Immigrants from Nigeria vs Immigrants from Europe Householder Income Under 25 years
COMPARE
Immigrants from Nigeria
Immigrants from Europe
Householder Income Under 25 years
Householder Income Under 25 years Comparison
Immigrants from Nigeria
Immigrants from Europe
$49,174
HOUSEHOLDER INCOME UNDER 25 YEARS
0.1/ 100
METRIC RATING
283rd/ 347
METRIC RANK
$55,022
HOUSEHOLDER INCOME UNDER 25 YEARS
99.9/ 100
METRIC RATING
61st/ 347
METRIC RANK
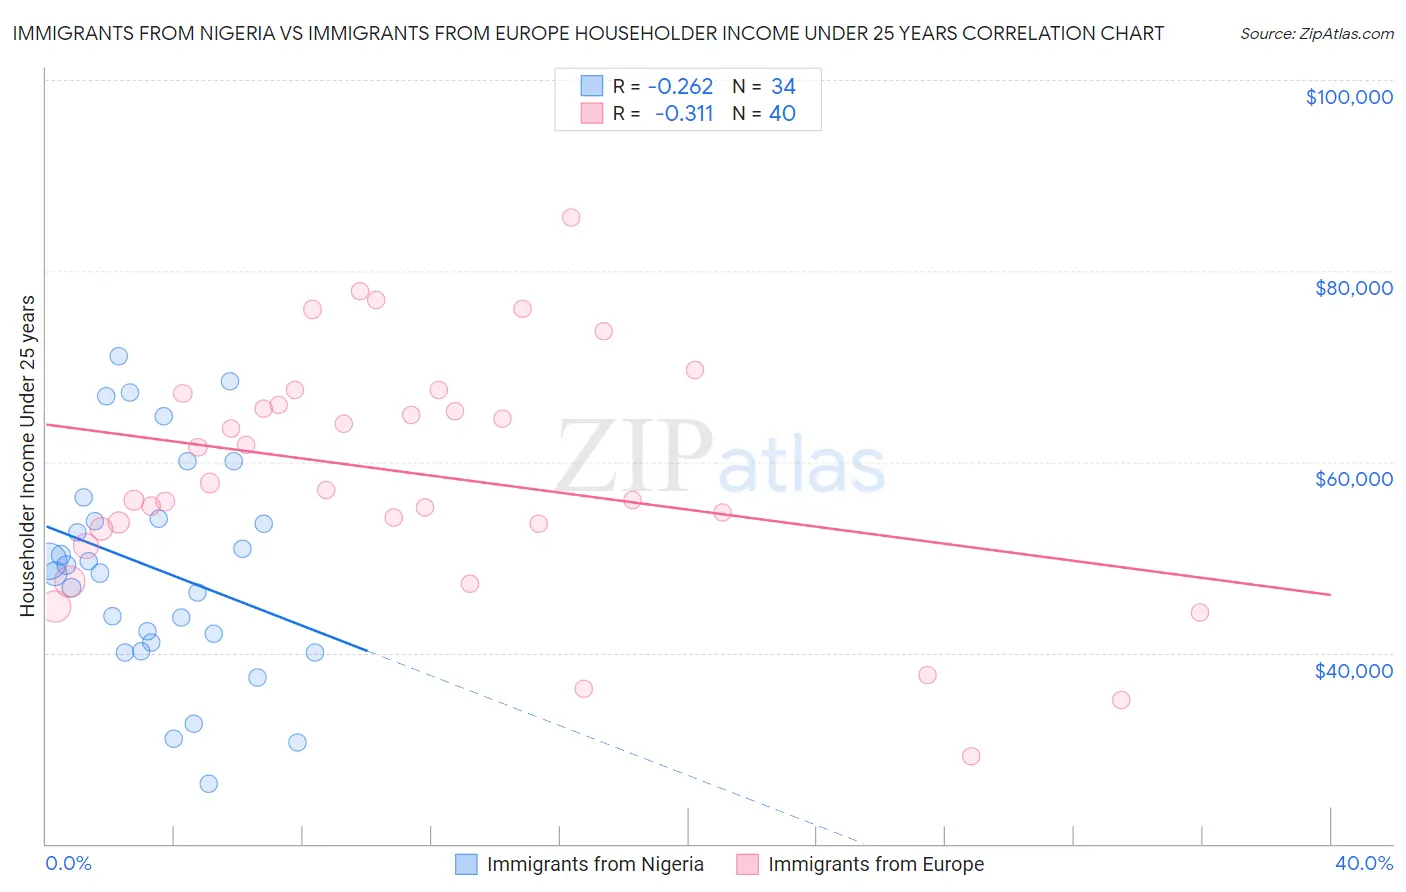
Immigrants from Nigeria vs Immigrants from Europe Householder Income Under 25 years Correlation Chart
The statistical analysis conducted on geographies consisting of 250,876,888 people shows a weak negative correlation between the proportion of Immigrants from Nigeria and household income with householder under the age of 25 in the United States with a correlation coefficient (R) of -0.262 and weighted average of $49,174. Similarly, the statistical analysis conducted on geographies consisting of 429,730,992 people shows a mild negative correlation between the proportion of Immigrants from Europe and household income with householder under the age of 25 in the United States with a correlation coefficient (R) of -0.311 and weighted average of $55,022, a difference of 11.9%.
Householder Income Under 25 years Correlation Summary
| Measurement | Immigrants from Nigeria | Immigrants from Europe |
| Minimum | $26,315 | $29,167 |
| Maximum | $71,114 | $85,625 |
| Range | $44,799 | $56,458 |
| Mean | $48,800 | $58,753 |
| Median | $48,781 | $57,388 |
| Interquartile 25% (IQ1) | $41,112 | $53,236 |
| Interquartile 75% (IQ3) | $54,053 | $66,581 |
| Interquartile Range (IQR) | $12,941 | $13,345 |
| Standard Deviation (Sample) | $11,278 | $12,547 |
| Standard Deviation (Population) | $11,111 | $12,389 |
Similar Demographics by Householder Income Under 25 years
Demographics Similar to Immigrants from Nigeria by Householder Income Under 25 years
In terms of householder income under 25 years, the demographic groups most similar to Immigrants from Nigeria are Carpatho Rusyn ($49,113, a difference of 0.12%), Alsatian ($49,267, a difference of 0.19%), Scotch-Irish ($49,039, a difference of 0.28%), Nonimmigrants ($49,348, a difference of 0.35%), and Hmong ($49,364, a difference of 0.39%).
| Demographics | Rating | Rank | Householder Income Under 25 years |
| Dominicans | 0.2 /100 | #276 | Tragic $49,633 |
| Immigrants | Western Africa | 0.2 /100 | #277 | Tragic $49,621 |
| Nigerians | 0.1 /100 | #278 | Tragic $49,416 |
| Apache | 0.1 /100 | #279 | Tragic $49,395 |
| Hmong | 0.1 /100 | #280 | Tragic $49,364 |
| Immigrants | Nonimmigrants | 0.1 /100 | #281 | Tragic $49,348 |
| Alsatians | 0.1 /100 | #282 | Tragic $49,267 |
| Immigrants | Nigeria | 0.1 /100 | #283 | Tragic $49,174 |
| Carpatho Rusyns | 0.1 /100 | #284 | Tragic $49,113 |
| Scotch-Irish | 0.0 /100 | #285 | Tragic $49,039 |
| French American Indians | 0.0 /100 | #286 | Tragic $48,977 |
| Senegalese | 0.0 /100 | #287 | Tragic $48,953 |
| Liberians | 0.0 /100 | #288 | Tragic $48,917 |
| Hondurans | 0.0 /100 | #289 | Tragic $48,885 |
| Americans | 0.0 /100 | #290 | Tragic $48,860 |
Demographics Similar to Immigrants from Europe by Householder Income Under 25 years
In terms of householder income under 25 years, the demographic groups most similar to Immigrants from Europe are Immigrants from Lithuania ($55,028, a difference of 0.010%), Native Hawaiian ($55,158, a difference of 0.25%), Immigrants from Uzbekistan ($54,846, a difference of 0.32%), Guyanese ($55,210, a difference of 0.34%), and Immigrants from Belgium ($54,830, a difference of 0.35%).
| Demographics | Rating | Rank | Householder Income Under 25 years |
| Sri Lankans | 100.0 /100 | #54 | Exceptional $55,470 |
| Immigrants | Ukraine | 100.0 /100 | #55 | Exceptional $55,447 |
| Salvadorans | 100.0 /100 | #56 | Exceptional $55,412 |
| Soviet Union | 100.0 /100 | #57 | Exceptional $55,340 |
| Guyanese | 99.9 /100 | #58 | Exceptional $55,210 |
| Native Hawaiians | 99.9 /100 | #59 | Exceptional $55,158 |
| Immigrants | Lithuania | 99.9 /100 | #60 | Exceptional $55,028 |
| Immigrants | Europe | 99.9 /100 | #61 | Exceptional $55,022 |
| Immigrants | Uzbekistan | 99.8 /100 | #62 | Exceptional $54,846 |
| Immigrants | Belgium | 99.8 /100 | #63 | Exceptional $54,830 |
| Burmese | 99.8 /100 | #64 | Exceptional $54,800 |
| Yup'ik | 99.8 /100 | #65 | Exceptional $54,732 |
| Immigrants | Bangladesh | 99.8 /100 | #66 | Exceptional $54,714 |
| Okinawans | 99.8 /100 | #67 | Exceptional $54,701 |
| Tsimshian | 99.8 /100 | #68 | Exceptional $54,649 |