Immigrants from Nepal vs Somali Median Family Income
COMPARE
Immigrants from Nepal
Somali
Median Family Income
Median Family Income Comparison
Immigrants from Nepal
Somalis
$104,966
MEDIAN FAMILY INCOME
76.3/ 100
METRIC RATING
154th/ 347
METRIC RANK
$94,085
MEDIAN FAMILY INCOME
1.2/ 100
METRIC RATING
240th/ 347
METRIC RANK
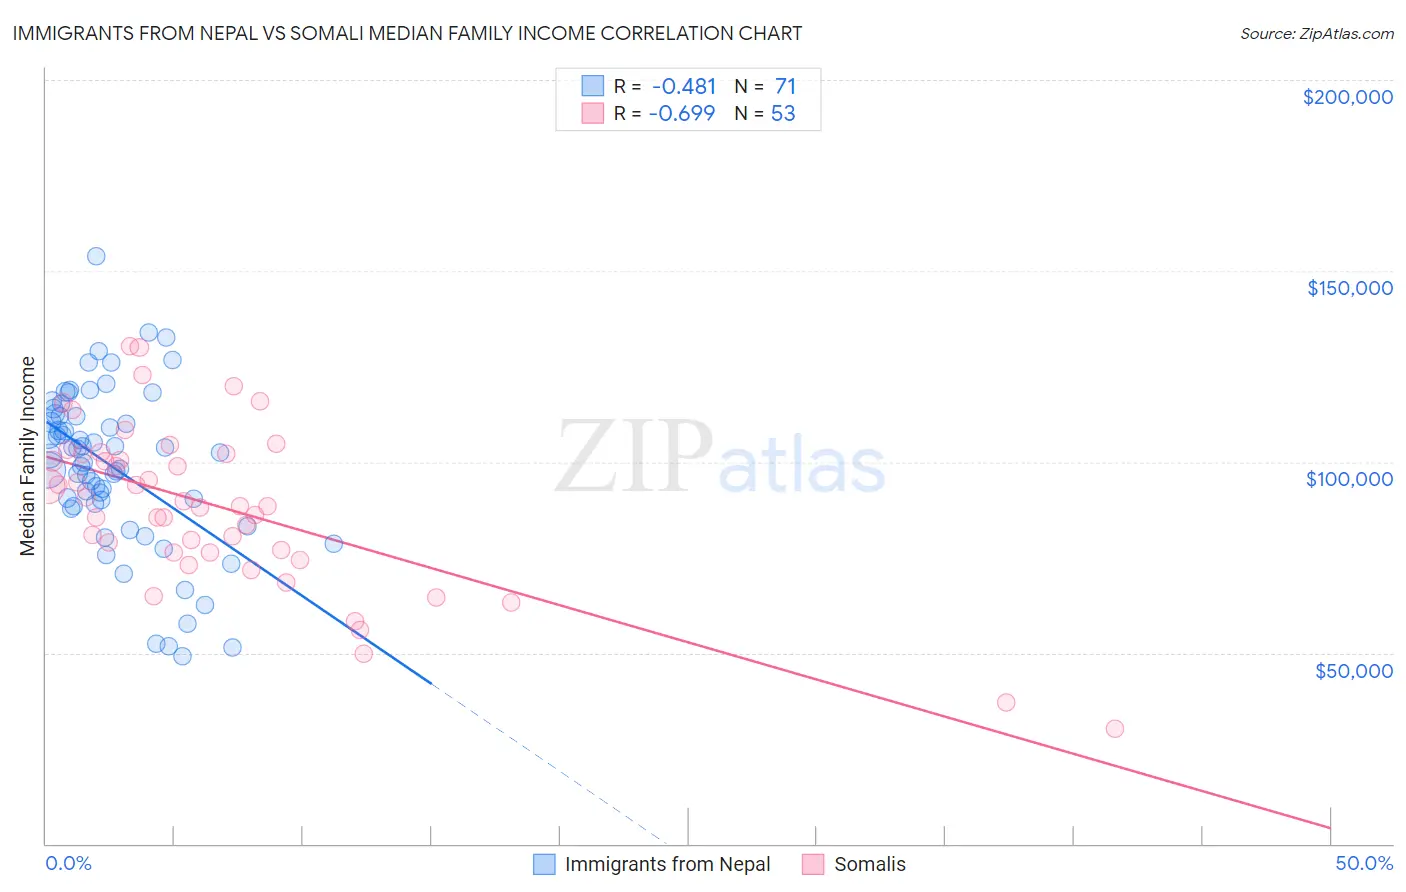
Immigrants from Nepal vs Somali Median Family Income Correlation Chart
The statistical analysis conducted on geographies consisting of 186,649,398 people shows a moderate negative correlation between the proportion of Immigrants from Nepal and median family income in the United States with a correlation coefficient (R) of -0.481 and weighted average of $104,966. Similarly, the statistical analysis conducted on geographies consisting of 99,278,232 people shows a significant negative correlation between the proportion of Somalis and median family income in the United States with a correlation coefficient (R) of -0.699 and weighted average of $94,085, a difference of 11.6%.
Median Family Income Correlation Summary
| Measurement | Immigrants from Nepal | Somali |
| Minimum | $49,167 | $29,978 |
| Maximum | $153,934 | $130,246 |
| Range | $104,767 | $100,268 |
| Mean | $98,602 | $88,236 |
| Median | $101,530 | $88,476 |
| Interquartile 25% (IQ1) | $88,483 | $76,386 |
| Interquartile 75% (IQ3) | $112,054 | $102,172 |
| Interquartile Range (IQR) | $23,571 | $25,786 |
| Standard Deviation (Sample) | $21,122 | $21,250 |
| Standard Deviation (Population) | $20,972 | $21,049 |
Similar Demographics by Median Family Income
Demographics Similar to Immigrants from Nepal by Median Family Income
In terms of median family income, the demographic groups most similar to Immigrants from Nepal are Native Hawaiian ($104,910, a difference of 0.050%), Slavic ($105,144, a difference of 0.17%), Basque ($104,760, a difference of 0.20%), Immigrants from Albania ($105,285, a difference of 0.30%), and Peruvian ($105,444, a difference of 0.45%).
| Demographics | Rating | Rank | Median Family Income |
| Immigrants | Chile | 82.1 /100 | #147 | Excellent $105,655 |
| Hungarians | 81.7 /100 | #148 | Excellent $105,609 |
| Immigrants | Germany | 80.9 /100 | #149 | Excellent $105,507 |
| Irish | 80.5 /100 | #150 | Excellent $105,453 |
| Peruvians | 80.4 /100 | #151 | Excellent $105,444 |
| Immigrants | Albania | 79.1 /100 | #152 | Good $105,285 |
| Slavs | 77.9 /100 | #153 | Good $105,144 |
| Immigrants | Nepal | 76.3 /100 | #154 | Good $104,966 |
| Native Hawaiians | 75.8 /100 | #155 | Good $104,910 |
| Basques | 74.4 /100 | #156 | Good $104,760 |
| Moroccans | 71.6 /100 | #157 | Good $104,488 |
| Scandinavians | 70.8 /100 | #158 | Good $104,410 |
| Swiss | 70.7 /100 | #159 | Good $104,396 |
| Scottish | 69.5 /100 | #160 | Good $104,288 |
| Icelanders | 69.4 /100 | #161 | Good $104,282 |
Demographics Similar to Somalis by Median Family Income
In terms of median family income, the demographic groups most similar to Somalis are Salvadoran ($94,109, a difference of 0.030%), Nepalese ($94,153, a difference of 0.070%), Immigrants from Trinidad and Tobago ($93,988, a difference of 0.10%), Barbadian ($93,919, a difference of 0.18%), and German Russian ($93,858, a difference of 0.24%).
| Demographics | Rating | Rank | Median Family Income |
| Immigrants | Bangladesh | 1.6 /100 | #233 | Tragic $94,665 |
| Immigrants | Western Africa | 1.6 /100 | #234 | Tragic $94,638 |
| Immigrants | Burma/Myanmar | 1.5 /100 | #235 | Tragic $94,472 |
| Trinidadians and Tobagonians | 1.5 /100 | #236 | Tragic $94,466 |
| Alaskan Athabascans | 1.5 /100 | #237 | Tragic $94,429 |
| Nepalese | 1.3 /100 | #238 | Tragic $94,153 |
| Salvadorans | 1.2 /100 | #239 | Tragic $94,109 |
| Somalis | 1.2 /100 | #240 | Tragic $94,085 |
| Immigrants | Trinidad and Tobago | 1.2 /100 | #241 | Tragic $93,988 |
| Barbadians | 1.1 /100 | #242 | Tragic $93,919 |
| German Russians | 1.1 /100 | #243 | Tragic $93,858 |
| Sub-Saharan Africans | 1.0 /100 | #244 | Tragic $93,748 |
| Immigrants | Middle Africa | 1.0 /100 | #245 | Tragic $93,593 |
| Guyanese | 0.9 /100 | #246 | Tragic $93,373 |
| Immigrants | Senegal | 0.7 /100 | #247 | Tragic $92,912 |