Immigrants from Moldova vs Spanish American Median Male Earnings
COMPARE
Immigrants from Moldova
Spanish American
Median Male Earnings
Median Male Earnings Comparison
Immigrants from Moldova
Spanish Americans
$59,417
MEDIAN MALE EARNINGS
99.2/ 100
METRIC RATING
89th/ 347
METRIC RANK
$49,008
MEDIAN MALE EARNINGS
0.5/ 100
METRIC RATING
267th/ 347
METRIC RANK
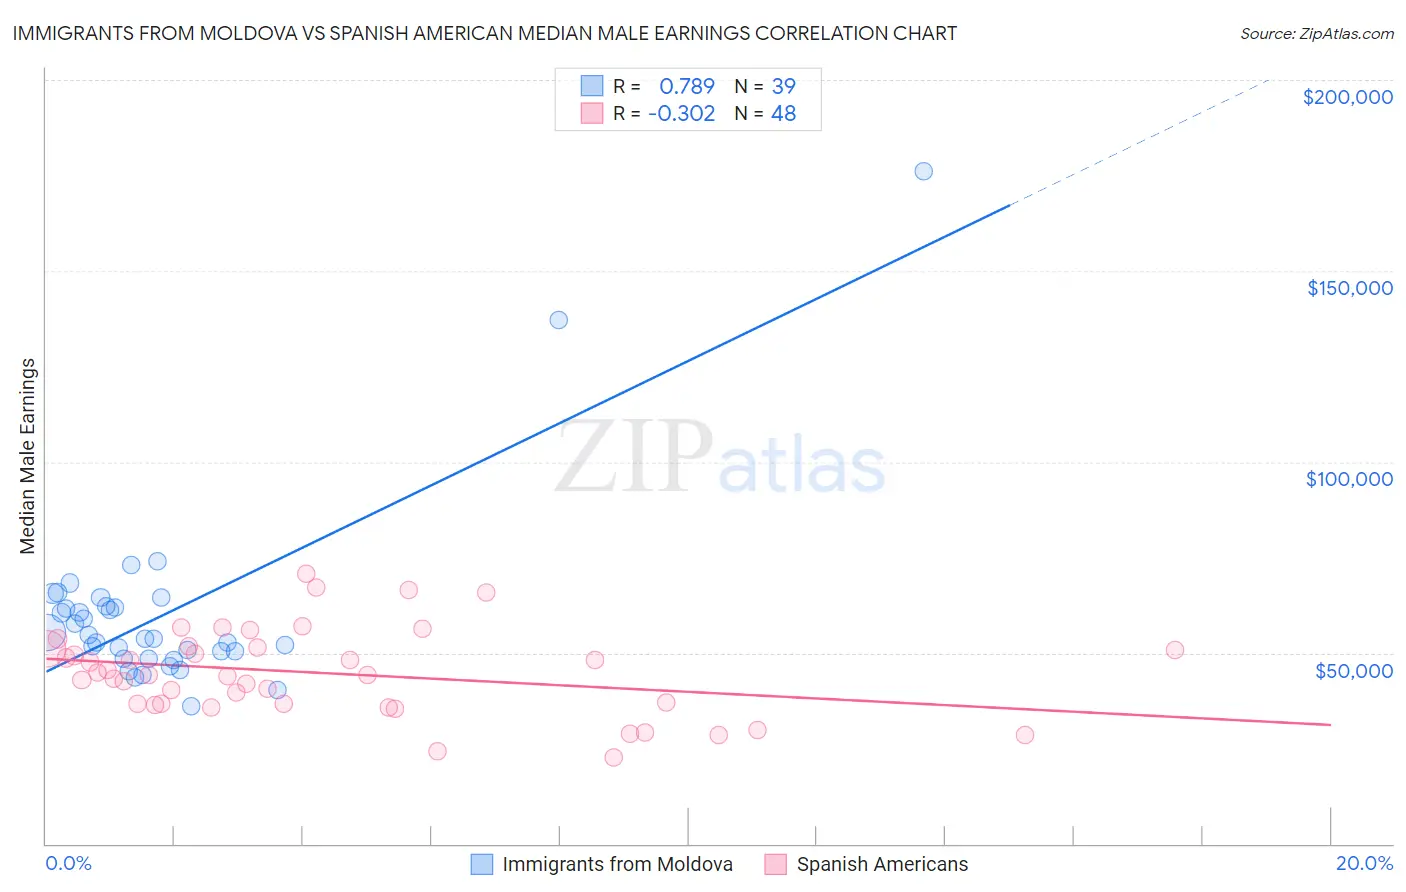
Immigrants from Moldova vs Spanish American Median Male Earnings Correlation Chart
The statistical analysis conducted on geographies consisting of 124,394,604 people shows a strong positive correlation between the proportion of Immigrants from Moldova and median male earnings in the United States with a correlation coefficient (R) of 0.789 and weighted average of $59,417. Similarly, the statistical analysis conducted on geographies consisting of 103,156,664 people shows a mild negative correlation between the proportion of Spanish Americans and median male earnings in the United States with a correlation coefficient (R) of -0.302 and weighted average of $49,008, a difference of 21.2%.
Median Male Earnings Correlation Summary
| Measurement | Immigrants from Moldova | Spanish American |
| Minimum | $35,909 | $22,500 |
| Maximum | $176,076 | $70,678 |
| Range | $140,167 | $48,178 |
| Mean | $60,240 | $44,710 |
| Median | $53,815 | $44,270 |
| Interquartile 25% (IQ1) | $48,477 | $36,560 |
| Interquartile 75% (IQ3) | $62,160 | $51,208 |
| Interquartile Range (IQR) | $13,683 | $14,648 |
| Standard Deviation (Sample) | $24,701 | $11,259 |
| Standard Deviation (Population) | $24,383 | $11,141 |
Similar Demographics by Median Male Earnings
Demographics Similar to Immigrants from Moldova by Median Male Earnings
In terms of median male earnings, the demographic groups most similar to Immigrants from Moldova are Austrian ($59,359, a difference of 0.10%), Laotian ($59,351, a difference of 0.11%), Immigrants from Argentina ($59,491, a difference of 0.12%), Immigrants from England ($59,527, a difference of 0.18%), and Macedonian ($59,522, a difference of 0.18%).
| Demographics | Rating | Rank | Median Male Earnings |
| Croatians | 99.4 /100 | #82 | Exceptional $59,715 |
| Immigrants | Italy | 99.4 /100 | #83 | Exceptional $59,691 |
| Afghans | 99.3 /100 | #84 | Exceptional $59,554 |
| Italians | 99.3 /100 | #85 | Exceptional $59,551 |
| Immigrants | England | 99.3 /100 | #86 | Exceptional $59,527 |
| Macedonians | 99.3 /100 | #87 | Exceptional $59,522 |
| Immigrants | Argentina | 99.3 /100 | #88 | Exceptional $59,491 |
| Immigrants | Moldova | 99.2 /100 | #89 | Exceptional $59,417 |
| Austrians | 99.2 /100 | #90 | Exceptional $59,359 |
| Laotians | 99.2 /100 | #91 | Exceptional $59,351 |
| Immigrants | Kazakhstan | 99.1 /100 | #92 | Exceptional $59,278 |
| Immigrants | Southern Europe | 99.0 /100 | #93 | Exceptional $59,217 |
| Immigrants | North Macedonia | 99.0 /100 | #94 | Exceptional $59,189 |
| Immigrants | Lebanon | 98.6 /100 | #95 | Exceptional $58,835 |
| Albanians | 98.4 /100 | #96 | Exceptional $58,680 |
Demographics Similar to Spanish Americans by Median Male Earnings
In terms of median male earnings, the demographic groups most similar to Spanish Americans are Somali ($49,025, a difference of 0.040%), Ute ($48,899, a difference of 0.22%), Tsimshian ($48,836, a difference of 0.35%), Immigrants from Laos ($49,190, a difference of 0.37%), and Immigrants from Middle Africa ($49,201, a difference of 0.39%).
| Demographics | Rating | Rank | Median Male Earnings |
| Iroquois | 0.7 /100 | #260 | Tragic $49,374 |
| Liberians | 0.6 /100 | #261 | Tragic $49,318 |
| Immigrants | West Indies | 0.6 /100 | #262 | Tragic $49,271 |
| Nicaraguans | 0.6 /100 | #263 | Tragic $49,215 |
| Immigrants | Middle Africa | 0.6 /100 | #264 | Tragic $49,201 |
| Immigrants | Laos | 0.6 /100 | #265 | Tragic $49,190 |
| Somalis | 0.5 /100 | #266 | Tragic $49,025 |
| Spanish Americans | 0.5 /100 | #267 | Tragic $49,008 |
| Ute | 0.4 /100 | #268 | Tragic $48,899 |
| Tsimshian | 0.4 /100 | #269 | Tragic $48,836 |
| Potawatomi | 0.4 /100 | #270 | Tragic $48,768 |
| Cherokee | 0.3 /100 | #271 | Tragic $48,669 |
| Salvadorans | 0.3 /100 | #272 | Tragic $48,646 |
| Jamaicans | 0.3 /100 | #273 | Tragic $48,632 |
| Colville | 0.3 /100 | #274 | Tragic $48,516 |