Immigrants from Moldova vs Chinese Householder Income Over 65 years
COMPARE
Immigrants from Moldova
Chinese
Householder Income Over 65 years
Householder Income Over 65 years Comparison
Immigrants from Moldova
Chinese
$62,939
HOUSEHOLDER INCOME OVER 65 YEARS
88.7/ 100
METRIC RATING
122nd/ 347
METRIC RANK
$77,465
HOUSEHOLDER INCOME OVER 65 YEARS
100.0/ 100
METRIC RATING
1st/ 347
METRIC RANK
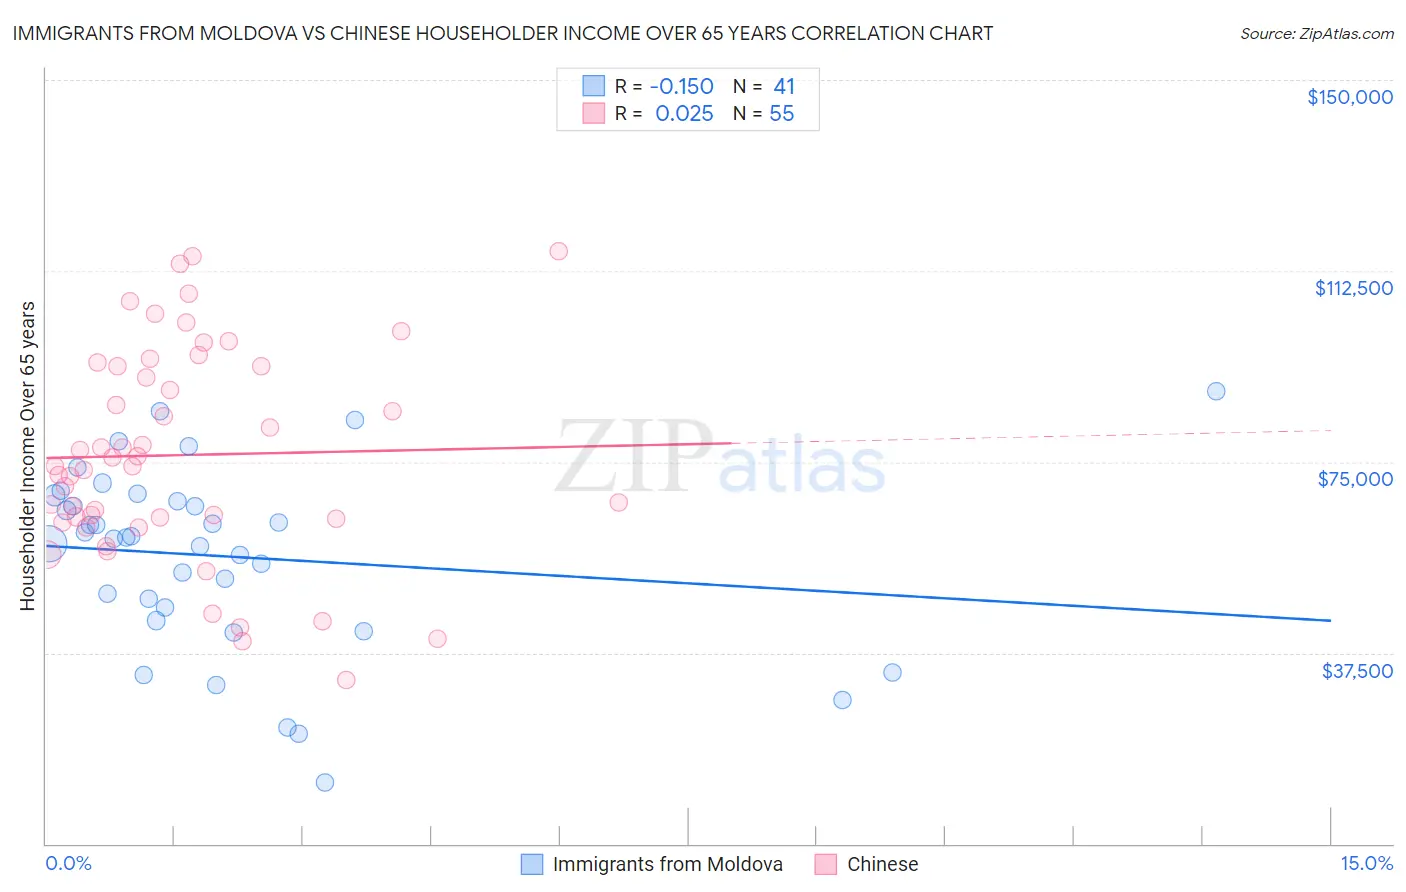
Immigrants from Moldova vs Chinese Householder Income Over 65 years Correlation Chart
The statistical analysis conducted on geographies consisting of 124,248,392 people shows a poor negative correlation between the proportion of Immigrants from Moldova and household income with householder over the age of 65 in the United States with a correlation coefficient (R) of -0.150 and weighted average of $62,939. Similarly, the statistical analysis conducted on geographies consisting of 64,728,631 people shows no correlation between the proportion of Chinese and household income with householder over the age of 65 in the United States with a correlation coefficient (R) of 0.025 and weighted average of $77,465, a difference of 23.1%.
Householder Income Over 65 years Correlation Summary
| Measurement | Immigrants from Moldova | Chinese |
| Minimum | $12,021 | $32,143 |
| Maximum | $88,833 | $116,276 |
| Range | $76,812 | $84,133 |
| Mean | $56,381 | $76,332 |
| Median | $60,083 | $74,246 |
| Interquartile 25% (IQ1) | $45,078 | $63,846 |
| Interquartile 75% (IQ3) | $67,835 | $93,750 |
| Interquartile Range (IQR) | $22,757 | $29,904 |
| Standard Deviation (Sample) | $17,894 | $20,626 |
| Standard Deviation (Population) | $17,674 | $20,438 |
Similar Demographics by Householder Income Over 65 years
Demographics Similar to Immigrants from Moldova by Householder Income Over 65 years
In terms of householder income over 65 years, the demographic groups most similar to Immigrants from Moldova are Tlingit-Haida ($62,922, a difference of 0.030%), Taiwanese ($62,894, a difference of 0.070%), Immigrants from Vietnam ($63,014, a difference of 0.12%), Soviet Union ($62,848, a difference of 0.14%), and Ukrainian ($63,032, a difference of 0.15%).
| Demographics | Rating | Rank | Householder Income Over 65 years |
| Croatians | 91.4 /100 | #115 | Exceptional $63,225 |
| Guamanians/Chamorros | 91.1 /100 | #116 | Exceptional $63,187 |
| Immigrants | Croatia | 90.9 /100 | #117 | Exceptional $63,168 |
| Danes | 90.5 /100 | #118 | Exceptional $63,117 |
| Immigrants | Jordan | 89.8 /100 | #119 | Excellent $63,041 |
| Ukrainians | 89.7 /100 | #120 | Excellent $63,032 |
| Immigrants | Vietnam | 89.5 /100 | #121 | Excellent $63,014 |
| Immigrants | Moldova | 88.7 /100 | #122 | Excellent $62,939 |
| Tlingit-Haida | 88.6 /100 | #123 | Excellent $62,922 |
| Taiwanese | 88.3 /100 | #124 | Excellent $62,894 |
| Soviet Union | 87.8 /100 | #125 | Excellent $62,848 |
| Peruvians | 86.8 /100 | #126 | Excellent $62,766 |
| Swedes | 86.4 /100 | #127 | Excellent $62,736 |
| Aleuts | 86.1 /100 | #128 | Excellent $62,708 |
| Immigrants | Eastern Europe | 85.9 /100 | #129 | Excellent $62,693 |
Demographics Similar to Chinese by Householder Income Over 65 years
In terms of householder income over 65 years, the demographic groups most similar to Chinese are Iranian ($77,429, a difference of 0.050%), Immigrants from Taiwan ($77,051, a difference of 0.54%), Filipino ($76,686, a difference of 1.0%), Immigrants from Iran ($75,081, a difference of 3.2%), and Bolivian ($74,245, a difference of 4.3%).
| Demographics | Rating | Rank | Householder Income Over 65 years |
| Chinese | 100.0 /100 | #1 | Exceptional $77,465 |
| Iranians | 100.0 /100 | #2 | Exceptional $77,429 |
| Immigrants | Taiwan | 100.0 /100 | #3 | Exceptional $77,051 |
| Filipinos | 100.0 /100 | #4 | Exceptional $76,686 |
| Immigrants | Iran | 100.0 /100 | #5 | Exceptional $75,081 |
| Bolivians | 100.0 /100 | #6 | Exceptional $74,245 |
| Immigrants | Bolivia | 100.0 /100 | #7 | Exceptional $73,434 |
| Immigrants | Singapore | 100.0 /100 | #8 | Exceptional $72,963 |
| Immigrants | India | 100.0 /100 | #9 | Exceptional $72,804 |
| Bhutanese | 100.0 /100 | #10 | Exceptional $72,288 |
| Thais | 100.0 /100 | #11 | Exceptional $72,099 |
| Cypriots | 100.0 /100 | #12 | Exceptional $71,714 |
| Immigrants | Hong Kong | 100.0 /100 | #13 | Exceptional $71,567 |
| Burmese | 100.0 /100 | #14 | Exceptional $71,139 |
| Native Hawaiians | 100.0 /100 | #15 | Exceptional $71,021 |