Immigrants from Mexico vs Immigrants from Middle Africa Householder Income Ages 25 - 44 years
COMPARE
Immigrants from Mexico
Immigrants from Middle Africa
Householder Income Ages 25 - 44 years
Householder Income Ages 25 - 44 years Comparison
Immigrants from Mexico
Immigrants from Middle Africa
$78,809
HOUSEHOLDER INCOME AGES 25 - 44 YEARS
0.0/ 100
METRIC RATING
318th/ 347
METRIC RANK
$82,254
HOUSEHOLDER INCOME AGES 25 - 44 YEARS
0.1/ 100
METRIC RATING
284th/ 347
METRIC RANK
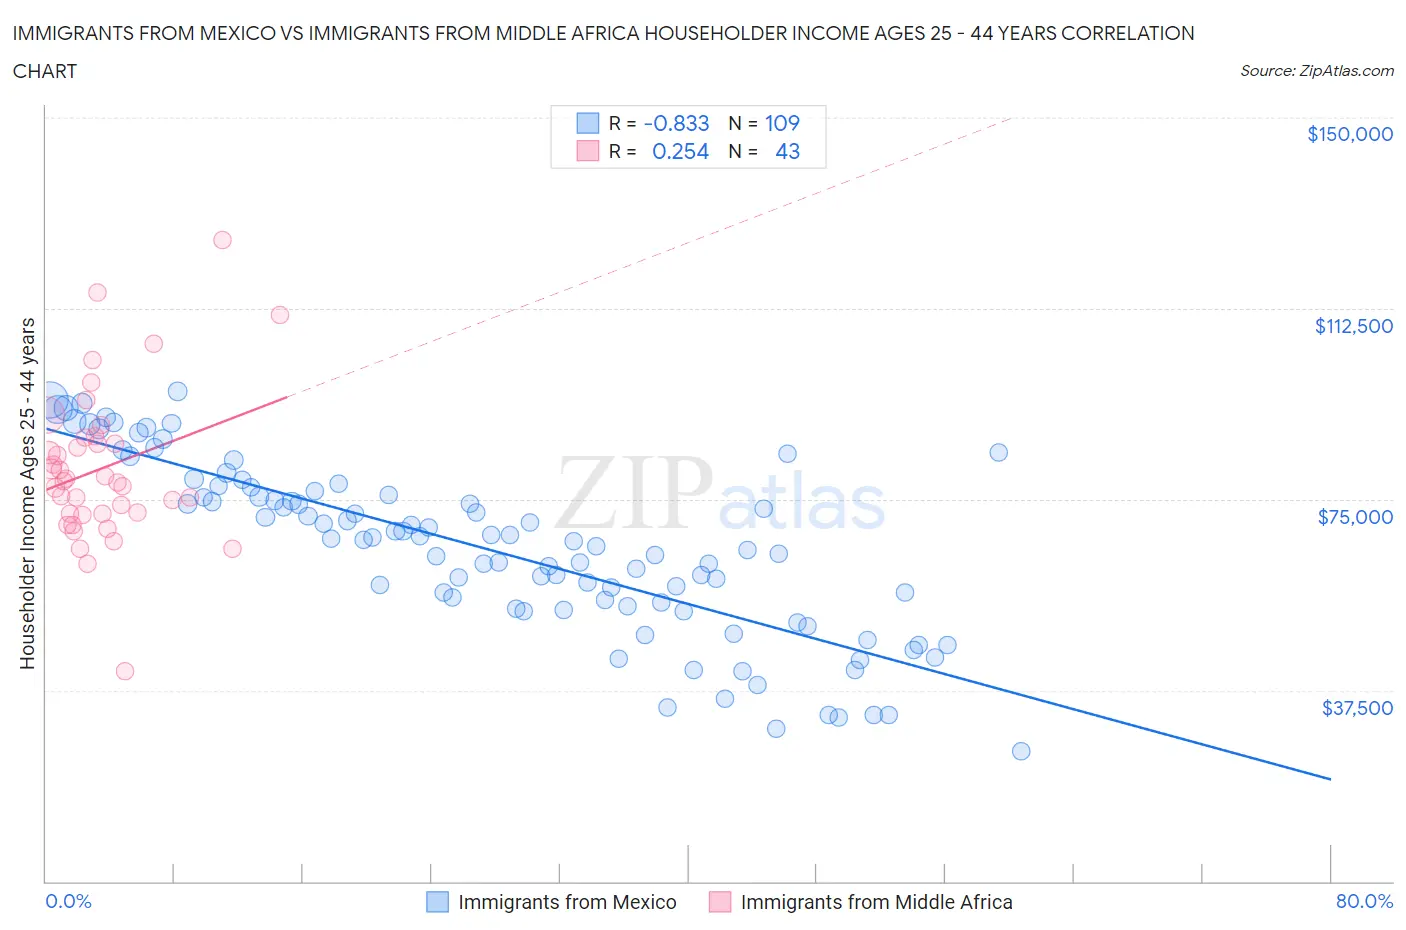
Immigrants from Mexico vs Immigrants from Middle Africa Householder Income Ages 25 - 44 years Correlation Chart
The statistical analysis conducted on geographies consisting of 510,586,481 people shows a very strong negative correlation between the proportion of Immigrants from Mexico and household income with householder between the ages 25 and 44 in the United States with a correlation coefficient (R) of -0.833 and weighted average of $78,809. Similarly, the statistical analysis conducted on geographies consisting of 202,520,719 people shows a weak positive correlation between the proportion of Immigrants from Middle Africa and household income with householder between the ages 25 and 44 in the United States with a correlation coefficient (R) of 0.254 and weighted average of $82,254, a difference of 4.4%.
Householder Income Ages 25 - 44 years Correlation Summary
| Measurement | Immigrants from Mexico | Immigrants from Middle Africa |
| Minimum | $25,500 | $41,159 |
| Maximum | $96,265 | $125,889 |
| Range | $70,765 | $84,730 |
| Mean | $65,144 | $81,156 |
| Median | $66,989 | $78,481 |
| Interquartile 25% (IQ1) | $53,834 | $72,155 |
| Interquartile 75% (IQ3) | $76,158 | $87,087 |
| Interquartile Range (IQR) | $22,324 | $14,931 |
| Standard Deviation (Sample) | $16,884 | $15,197 |
| Standard Deviation (Population) | $16,806 | $15,019 |
Similar Demographics by Householder Income Ages 25 - 44 years
Demographics Similar to Immigrants from Mexico by Householder Income Ages 25 - 44 years
In terms of householder income ages 25 - 44 years, the demographic groups most similar to Immigrants from Mexico are U.S. Virgin Islander ($78,911, a difference of 0.13%), African ($78,986, a difference of 0.22%), Ottawa ($79,012, a difference of 0.26%), Honduran ($78,540, a difference of 0.34%), and Cheyenne ($79,152, a difference of 0.44%).
| Demographics | Rating | Rank | Householder Income Ages 25 - 44 years |
| Indonesians | 0.0 /100 | #311 | Tragic $79,543 |
| Immigrants | Haiti | 0.0 /100 | #312 | Tragic $79,391 |
| Menominee | 0.0 /100 | #313 | Tragic $79,358 |
| Cheyenne | 0.0 /100 | #314 | Tragic $79,152 |
| Ottawa | 0.0 /100 | #315 | Tragic $79,012 |
| Africans | 0.0 /100 | #316 | Tragic $78,986 |
| U.S. Virgin Islanders | 0.0 /100 | #317 | Tragic $78,911 |
| Immigrants | Mexico | 0.0 /100 | #318 | Tragic $78,809 |
| Hondurans | 0.0 /100 | #319 | Tragic $78,540 |
| Choctaw | 0.0 /100 | #320 | Tragic $78,168 |
| Immigrants | Zaire | 0.0 /100 | #321 | Tragic $78,045 |
| Chickasaw | 0.0 /100 | #322 | Tragic $77,929 |
| Immigrants | Honduras | 0.0 /100 | #323 | Tragic $77,328 |
| Dutch West Indians | 0.0 /100 | #324 | Tragic $77,260 |
| Sioux | 0.0 /100 | #325 | Tragic $77,089 |
Demographics Similar to Immigrants from Middle Africa by Householder Income Ages 25 - 44 years
In terms of householder income ages 25 - 44 years, the demographic groups most similar to Immigrants from Middle Africa are Immigrants from Somalia ($82,188, a difference of 0.080%), Guatemalan ($82,331, a difference of 0.090%), Ute ($82,166, a difference of 0.11%), Immigrants from Latin America ($82,166, a difference of 0.11%), and Central American Indian ($82,355, a difference of 0.12%).
| Demographics | Rating | Rank | Householder Income Ages 25 - 44 years |
| Paiute | 0.2 /100 | #277 | Tragic $82,984 |
| Senegalese | 0.2 /100 | #278 | Tragic $82,852 |
| Pima | 0.1 /100 | #279 | Tragic $82,821 |
| Colville | 0.1 /100 | #280 | Tragic $82,604 |
| Cajuns | 0.1 /100 | #281 | Tragic $82,393 |
| Central American Indians | 0.1 /100 | #282 | Tragic $82,355 |
| Guatemalans | 0.1 /100 | #283 | Tragic $82,331 |
| Immigrants | Middle Africa | 0.1 /100 | #284 | Tragic $82,254 |
| Immigrants | Somalia | 0.1 /100 | #285 | Tragic $82,188 |
| Ute | 0.1 /100 | #286 | Tragic $82,166 |
| Immigrants | Latin America | 0.1 /100 | #287 | Tragic $82,166 |
| Comanche | 0.1 /100 | #288 | Tragic $82,152 |
| Shoshone | 0.1 /100 | #289 | Tragic $82,062 |
| Liberians | 0.1 /100 | #290 | Tragic $82,005 |
| Potawatomi | 0.1 /100 | #291 | Tragic $81,774 |