Immigrants from Kenya vs Immigrants from Cameroon Median Male Earnings
COMPARE
Immigrants from Kenya
Immigrants from Cameroon
Median Male Earnings
Median Male Earnings Comparison
Immigrants from Kenya
Immigrants from Cameroon
$53,427
MEDIAN MALE EARNINGS
26.0/ 100
METRIC RATING
197th/ 347
METRIC RANK
$52,119
MEDIAN MALE EARNINGS
8.9/ 100
METRIC RATING
215th/ 347
METRIC RANK
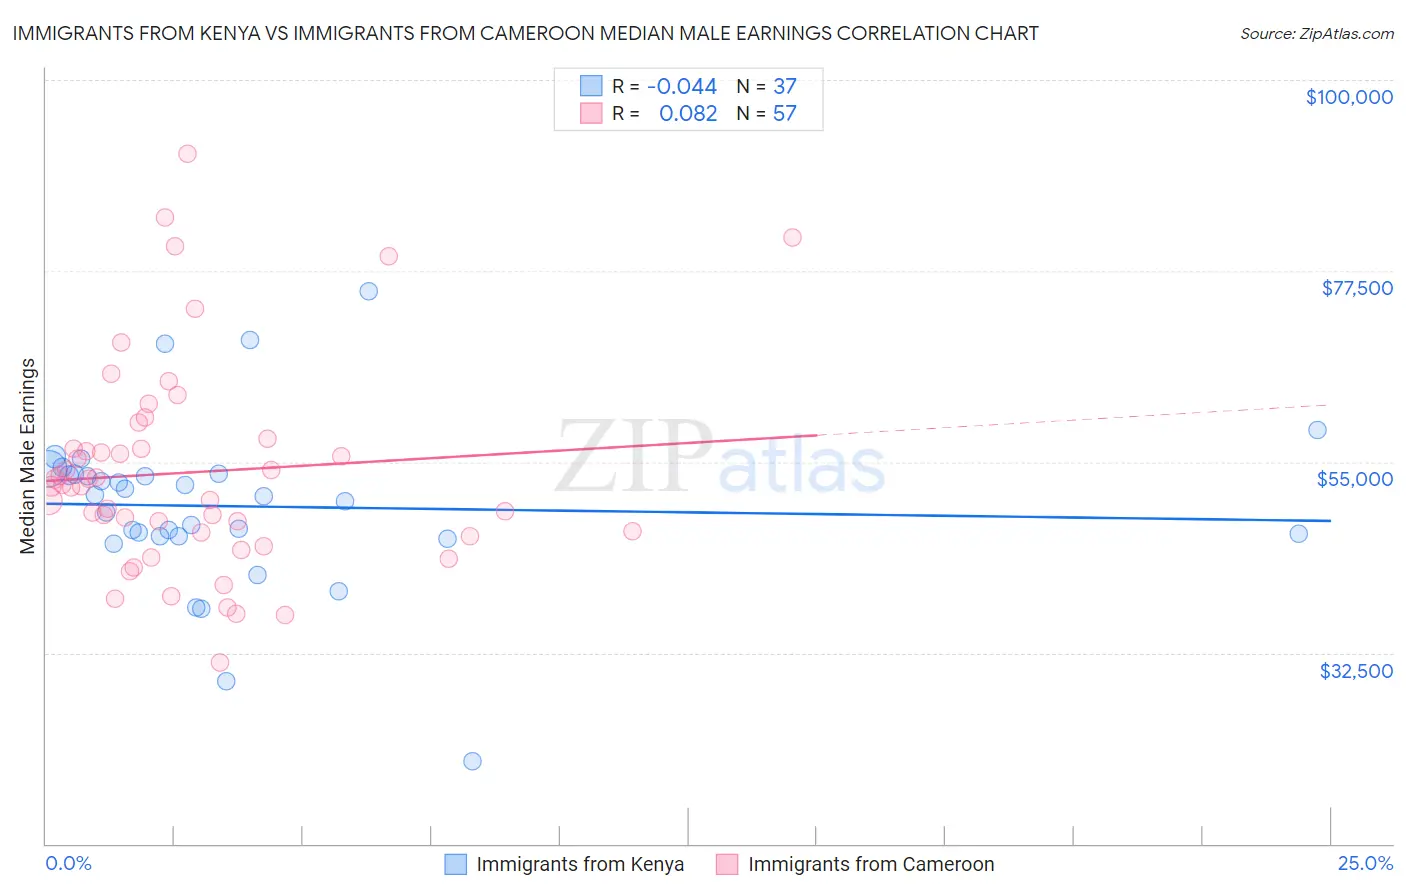
Immigrants from Kenya vs Immigrants from Cameroon Median Male Earnings Correlation Chart
The statistical analysis conducted on geographies consisting of 218,068,139 people shows no correlation between the proportion of Immigrants from Kenya and median male earnings in the United States with a correlation coefficient (R) of -0.044 and weighted average of $53,427. Similarly, the statistical analysis conducted on geographies consisting of 130,759,044 people shows a slight positive correlation between the proportion of Immigrants from Cameroon and median male earnings in the United States with a correlation coefficient (R) of 0.082 and weighted average of $52,119, a difference of 2.5%.
Median Male Earnings Correlation Summary
| Measurement | Immigrants from Kenya | Immigrants from Cameroon |
| Minimum | $19,659 | $31,418 |
| Maximum | $75,179 | $91,296 |
| Range | $55,520 | $59,878 |
| Mean | $49,751 | $53,781 |
| Median | $50,930 | $52,076 |
| Interquartile 25% (IQ1) | $46,171 | $46,476 |
| Interquartile 75% (IQ3) | $53,573 | $57,139 |
| Interquartile Range (IQR) | $7,402 | $10,663 |
| Standard Deviation (Sample) | $9,966 | $12,326 |
| Standard Deviation (Population) | $9,831 | $12,218 |
Demographics Similar to Immigrants from Kenya and Immigrants from Cameroon by Median Male Earnings
In terms of median male earnings, the demographic groups most similar to Immigrants from Kenya are Immigrants from Africa ($53,457, a difference of 0.060%), Immigrants from Costa Rica ($53,237, a difference of 0.36%), Tongan ($53,218, a difference of 0.39%), Immigrants from Thailand ($52,908, a difference of 0.98%), and Immigrants from Bosnia and Herzegovina ($52,869, a difference of 1.1%). Similarly, the demographic groups most similar to Immigrants from Cameroon are Nonimmigrants ($52,170, a difference of 0.10%), Immigrants from Venezuela ($52,041, a difference of 0.15%), Native Hawaiian ($52,306, a difference of 0.36%), Cajun ($52,325, a difference of 0.40%), and Delaware ($52,412, a difference of 0.56%).
| Demographics | Rating | Rank | Median Male Earnings |
| Immigrants | Africa | 26.6 /100 | #196 | Fair $53,457 |
| Immigrants | Kenya | 26.0 /100 | #197 | Fair $53,427 |
| Immigrants | Costa Rica | 22.6 /100 | #198 | Fair $53,237 |
| Tongans | 22.3 /100 | #199 | Fair $53,218 |
| Immigrants | Thailand | 17.5 /100 | #200 | Poor $52,908 |
| Immigrants | Bosnia and Herzegovina | 16.9 /100 | #201 | Poor $52,869 |
| Immigrants | Uruguay | 16.8 /100 | #202 | Poor $52,860 |
| Panamanians | 16.5 /100 | #203 | Poor $52,835 |
| Ghanaians | 16.1 /100 | #204 | Poor $52,810 |
| Immigrants | Colombia | 15.0 /100 | #205 | Poor $52,725 |
| Immigrants | Iraq | 14.5 /100 | #206 | Poor $52,681 |
| Vietnamese | 12.7 /100 | #207 | Poor $52,525 |
| Venezuelans | 12.5 /100 | #208 | Poor $52,510 |
| Bermudans | 12.1 /100 | #209 | Poor $52,465 |
| Delaware | 11.5 /100 | #210 | Poor $52,412 |
| Tlingit-Haida | 11.5 /100 | #211 | Poor $52,409 |
| Cajuns | 10.7 /100 | #212 | Poor $52,325 |
| Native Hawaiians | 10.5 /100 | #213 | Poor $52,306 |
| Immigrants | Nonimmigrants | 9.3 /100 | #214 | Tragic $52,170 |
| Immigrants | Cameroon | 8.9 /100 | #215 | Tragic $52,119 |
| Immigrants | Venezuela | 8.3 /100 | #216 | Tragic $52,041 |