Immigrants from Hong Kong vs Immigrants from Cambodia Householder Income Over 65 years
COMPARE
Immigrants from Hong Kong
Immigrants from Cambodia
Householder Income Over 65 years
Householder Income Over 65 years Comparison
Immigrants from Hong Kong
Immigrants from Cambodia
$71,567
HOUSEHOLDER INCOME OVER 65 YEARS
100.0/ 100
METRIC RATING
13th/ 347
METRIC RANK
$57,580
HOUSEHOLDER INCOME OVER 65 YEARS
2.8/ 100
METRIC RATING
230th/ 347
METRIC RANK
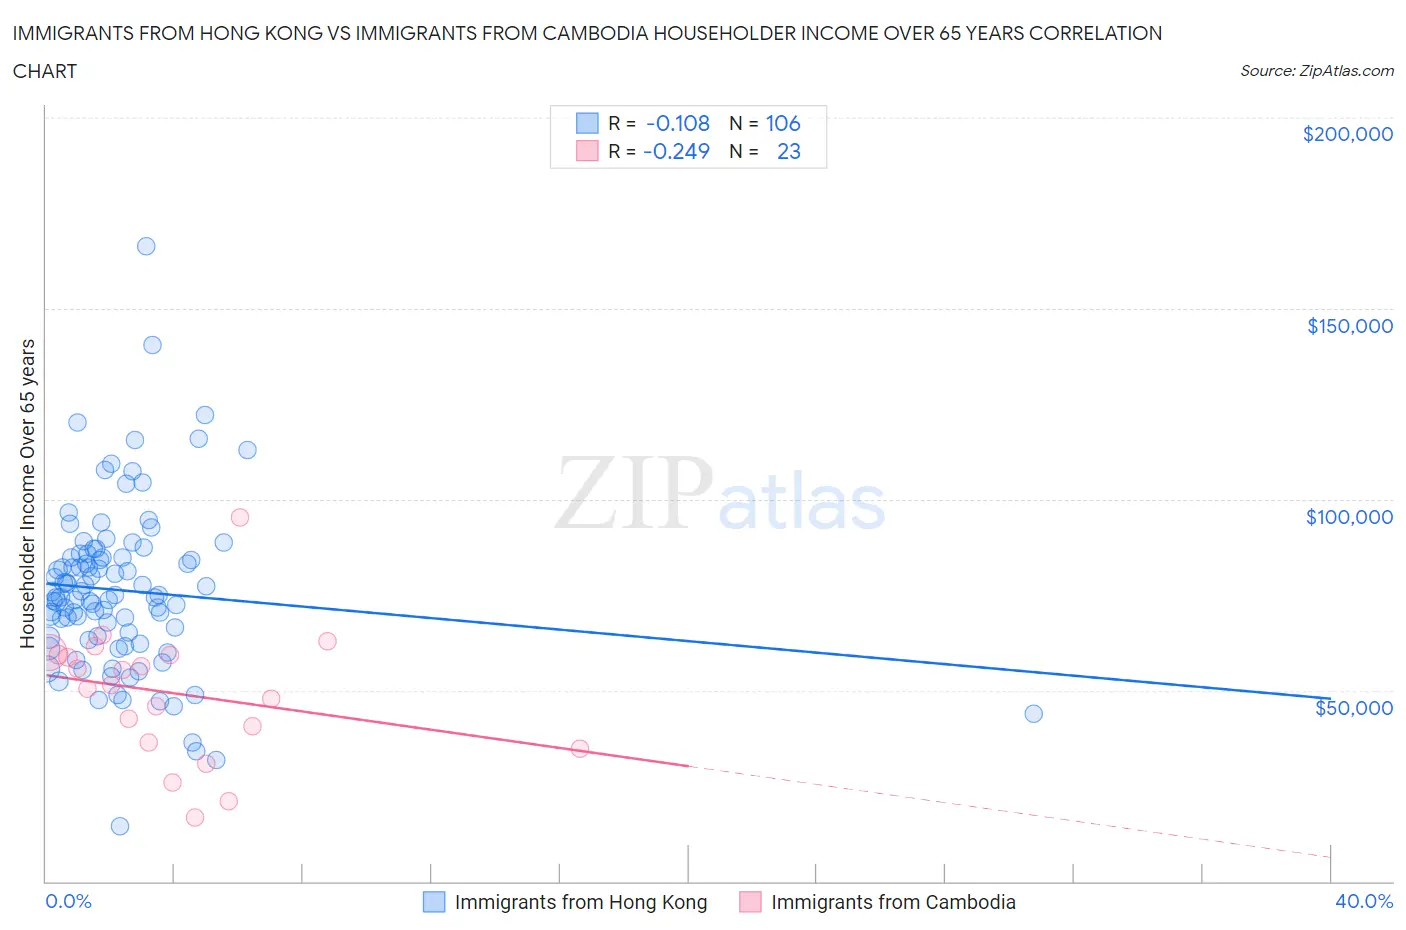
Immigrants from Hong Kong vs Immigrants from Cambodia Householder Income Over 65 years Correlation Chart
The statistical analysis conducted on geographies consisting of 253,485,183 people shows a poor negative correlation between the proportion of Immigrants from Hong Kong and household income with householder over the age of 65 in the United States with a correlation coefficient (R) of -0.108 and weighted average of $71,567. Similarly, the statistical analysis conducted on geographies consisting of 204,993,157 people shows a weak negative correlation between the proportion of Immigrants from Cambodia and household income with householder over the age of 65 in the United States with a correlation coefficient (R) of -0.249 and weighted average of $57,580, a difference of 24.3%.
Householder Income Over 65 years Correlation Summary
| Measurement | Immigrants from Hong Kong | Immigrants from Cambodia |
| Minimum | $14,323 | $16,632 |
| Maximum | $166,250 | $95,250 |
| Range | $151,927 | $78,618 |
| Mean | $76,158 | $49,242 |
| Median | $74,716 | $51,420 |
| Interquartile 25% (IQ1) | $63,807 | $36,323 |
| Interquartile 75% (IQ3) | $84,771 | $59,381 |
| Interquartile Range (IQR) | $20,964 | $23,058 |
| Standard Deviation (Sample) | $21,933 | $17,189 |
| Standard Deviation (Population) | $21,829 | $16,811 |
Similar Demographics by Householder Income Over 65 years
Demographics Similar to Immigrants from Hong Kong by Householder Income Over 65 years
In terms of householder income over 65 years, the demographic groups most similar to Immigrants from Hong Kong are Cypriot ($71,714, a difference of 0.20%), Burmese ($71,139, a difference of 0.60%), Thai ($72,099, a difference of 0.74%), Native Hawaiian ($71,021, a difference of 0.77%), and Bhutanese ($72,288, a difference of 1.0%).
| Demographics | Rating | Rank | Householder Income Over 65 years |
| Bolivians | 100.0 /100 | #6 | Exceptional $74,245 |
| Immigrants | Bolivia | 100.0 /100 | #7 | Exceptional $73,434 |
| Immigrants | Singapore | 100.0 /100 | #8 | Exceptional $72,963 |
| Immigrants | India | 100.0 /100 | #9 | Exceptional $72,804 |
| Bhutanese | 100.0 /100 | #10 | Exceptional $72,288 |
| Thais | 100.0 /100 | #11 | Exceptional $72,099 |
| Cypriots | 100.0 /100 | #12 | Exceptional $71,714 |
| Immigrants | Hong Kong | 100.0 /100 | #13 | Exceptional $71,567 |
| Burmese | 100.0 /100 | #14 | Exceptional $71,139 |
| Native Hawaiians | 100.0 /100 | #15 | Exceptional $71,021 |
| Okinawans | 100.0 /100 | #16 | Exceptional $70,846 |
| Immigrants | Korea | 100.0 /100 | #17 | Exceptional $70,696 |
| Eastern Europeans | 100.0 /100 | #18 | Exceptional $70,470 |
| Indians (Asian) | 100.0 /100 | #19 | Exceptional $70,238 |
| Immigrants | South Central Asia | 100.0 /100 | #20 | Exceptional $70,103 |
Demographics Similar to Immigrants from Cambodia by Householder Income Over 65 years
In terms of householder income over 65 years, the demographic groups most similar to Immigrants from Cambodia are Immigrants from Colombia ($57,658, a difference of 0.14%), Nonimmigrants ($57,426, a difference of 0.27%), Immigrants from Venezuela ($57,371, a difference of 0.36%), Immigrants from Albania ($57,828, a difference of 0.43%), and Japanese ($57,919, a difference of 0.59%).
| Demographics | Rating | Rank | Householder Income Over 65 years |
| Tsimshian | 5.2 /100 | #223 | Tragic $58,202 |
| Bermudans | 5.1 /100 | #224 | Tragic $58,171 |
| Venezuelans | 4.4 /100 | #225 | Tragic $58,026 |
| French Canadians | 4.2 /100 | #226 | Tragic $57,975 |
| Japanese | 3.9 /100 | #227 | Tragic $57,919 |
| Immigrants | Albania | 3.6 /100 | #228 | Tragic $57,828 |
| Immigrants | Colombia | 3.0 /100 | #229 | Tragic $57,658 |
| Immigrants | Cambodia | 2.8 /100 | #230 | Tragic $57,580 |
| Immigrants | Nonimmigrants | 2.4 /100 | #231 | Tragic $57,426 |
| Immigrants | Venezuela | 2.3 /100 | #232 | Tragic $57,371 |
| Immigrants | Western Africa | 1.7 /100 | #233 | Tragic $57,119 |
| Immigrants | Burma/Myanmar | 1.7 /100 | #234 | Tragic $57,114 |
| Spanish Americans | 1.6 /100 | #235 | Tragic $57,021 |
| Immigrants | Uruguay | 1.5 /100 | #236 | Tragic $56,975 |
| Immigrants | Panama | 1.5 /100 | #237 | Tragic $56,944 |