Immigrants from Greece vs Uruguayan Median Earnings
COMPARE
Immigrants from Greece
Uruguayan
Median Earnings
Median Earnings Comparison
Immigrants from Greece
Uruguayans
$53,282
MEDIAN EARNINGS
100.0/ 100
METRIC RATING
33rd/ 347
METRIC RANK
$46,190
MEDIAN EARNINGS
41.6/ 100
METRIC RATING
185th/ 347
METRIC RANK
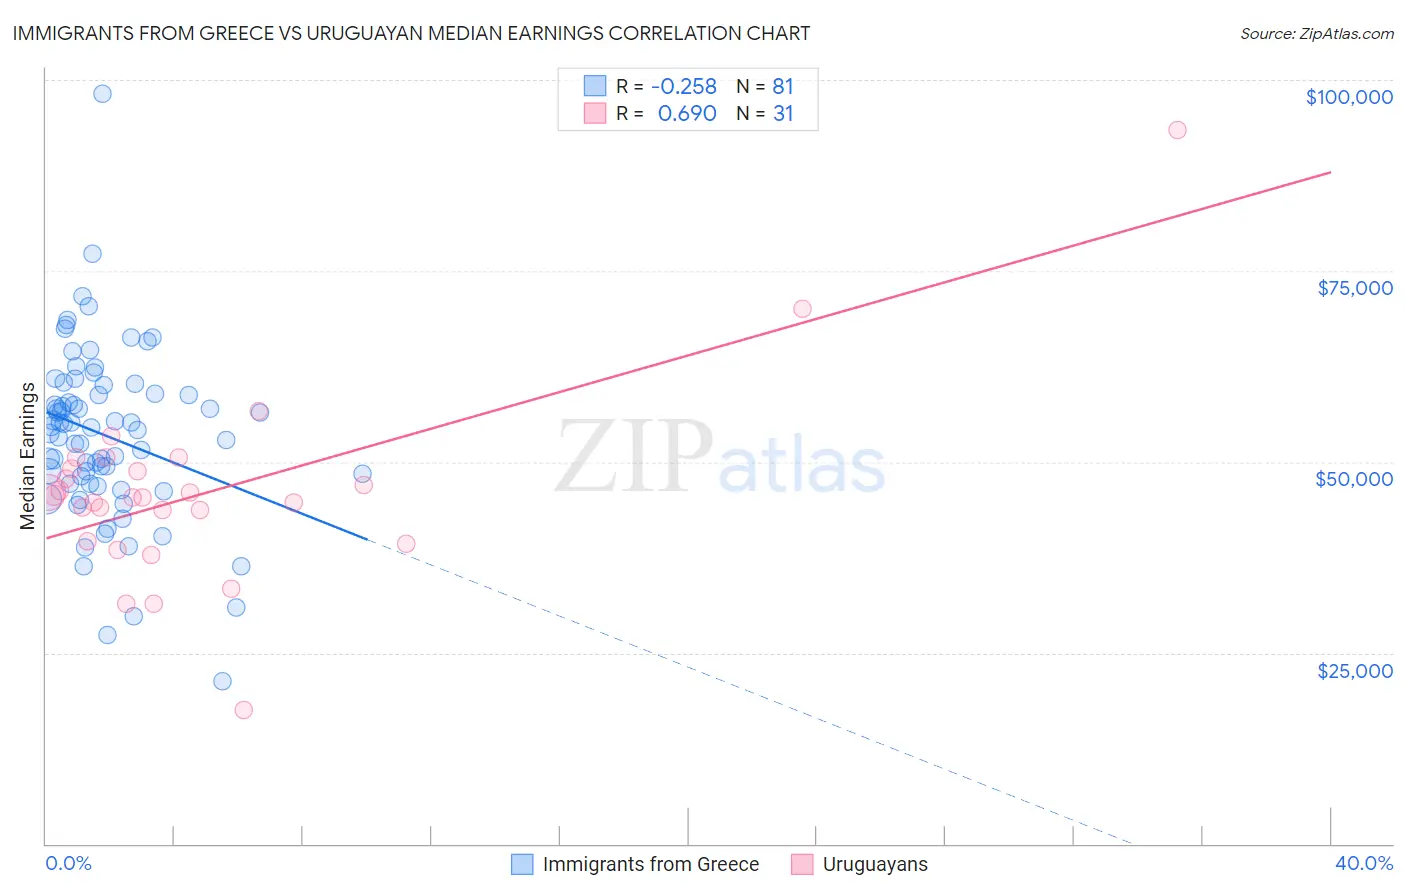
Immigrants from Greece vs Uruguayan Median Earnings Correlation Chart
The statistical analysis conducted on geographies consisting of 216,859,908 people shows a weak negative correlation between the proportion of Immigrants from Greece and median earnings in the United States with a correlation coefficient (R) of -0.258 and weighted average of $53,282. Similarly, the statistical analysis conducted on geographies consisting of 144,784,894 people shows a significant positive correlation between the proportion of Uruguayans and median earnings in the United States with a correlation coefficient (R) of 0.690 and weighted average of $46,190, a difference of 15.3%.
Median Earnings Correlation Summary
| Measurement | Immigrants from Greece | Uruguayan |
| Minimum | $21,296 | $17,500 |
| Maximum | $98,167 | $93,387 |
| Range | $76,871 | $75,887 |
| Mean | $53,424 | $45,994 |
| Median | $54,495 | $45,417 |
| Interquartile 25% (IQ1) | $47,153 | $39,561 |
| Interquartile 75% (IQ3) | $59,515 | $49,175 |
| Interquartile Range (IQR) | $12,362 | $9,613 |
| Standard Deviation (Sample) | $11,394 | $12,526 |
| Standard Deviation (Population) | $11,323 | $12,322 |
Similar Demographics by Median Earnings
Demographics Similar to Immigrants from Greece by Median Earnings
In terms of median earnings, the demographic groups most similar to Immigrants from Greece are Immigrants from Sri Lanka ($53,268, a difference of 0.030%), Immigrants from Asia ($53,310, a difference of 0.050%), Russian ($53,334, a difference of 0.10%), Immigrants from Switzerland ($53,211, a difference of 0.13%), and Immigrants from Denmark ($53,186, a difference of 0.18%).
| Demographics | Rating | Rank | Median Earnings |
| Immigrants | Northern Europe | 100.0 /100 | #26 | Exceptional $53,872 |
| Asians | 100.0 /100 | #27 | Exceptional $53,690 |
| Immigrants | France | 100.0 /100 | #28 | Exceptional $53,490 |
| Immigrants | Russia | 100.0 /100 | #29 | Exceptional $53,457 |
| Cambodians | 100.0 /100 | #30 | Exceptional $53,386 |
| Russians | 100.0 /100 | #31 | Exceptional $53,334 |
| Immigrants | Asia | 100.0 /100 | #32 | Exceptional $53,310 |
| Immigrants | Greece | 100.0 /100 | #33 | Exceptional $53,282 |
| Immigrants | Sri Lanka | 100.0 /100 | #34 | Exceptional $53,268 |
| Immigrants | Switzerland | 100.0 /100 | #35 | Exceptional $53,211 |
| Immigrants | Denmark | 100.0 /100 | #36 | Exceptional $53,186 |
| Immigrants | Belarus | 100.0 /100 | #37 | Exceptional $53,043 |
| Latvians | 100.0 /100 | #38 | Exceptional $53,001 |
| Immigrants | Turkey | 100.0 /100 | #39 | Exceptional $52,960 |
| Israelis | 100.0 /100 | #40 | Exceptional $52,937 |
Demographics Similar to Uruguayans by Median Earnings
In terms of median earnings, the demographic groups most similar to Uruguayans are Vietnamese ($46,172, a difference of 0.040%), Immigrants from Kenya ($46,214, a difference of 0.050%), Iraqi ($46,140, a difference of 0.11%), Immigrants from Armenia ($46,094, a difference of 0.21%), and French ($46,296, a difference of 0.23%).
| Demographics | Rating | Rank | Median Earnings |
| Colombians | 47.1 /100 | #178 | Average $46,349 |
| English | 46.5 /100 | #179 | Average $46,334 |
| Puget Sound Salish | 46.5 /100 | #180 | Average $46,333 |
| Immigrants | Cameroon | 46.4 /100 | #181 | Average $46,329 |
| Swiss | 45.9 /100 | #182 | Average $46,315 |
| French | 45.2 /100 | #183 | Average $46,296 |
| Immigrants | Kenya | 42.4 /100 | #184 | Average $46,214 |
| Uruguayans | 41.6 /100 | #185 | Average $46,190 |
| Vietnamese | 40.9 /100 | #186 | Average $46,172 |
| Iraqis | 39.9 /100 | #187 | Fair $46,140 |
| Immigrants | Armenia | 38.3 /100 | #188 | Fair $46,094 |
| Spaniards | 37.2 /100 | #189 | Fair $46,059 |
| French Canadians | 36.1 /100 | #190 | Fair $46,026 |
| Finns | 33.4 /100 | #191 | Fair $45,940 |
| Germans | 33.2 /100 | #192 | Fair $45,935 |