Immigrants from Greece vs Bulgarian Householder Income Ages 25 - 44 years
COMPARE
Immigrants from Greece
Bulgarian
Householder Income Ages 25 - 44 years
Householder Income Ages 25 - 44 years Comparison
Immigrants from Greece
Bulgarians
$110,103
HOUSEHOLDER INCOME AGES 25 - 44 YEARS
100.0/ 100
METRIC RATING
30th/ 347
METRIC RANK
$107,264
HOUSEHOLDER INCOME AGES 25 - 44 YEARS
99.9/ 100
METRIC RATING
48th/ 347
METRIC RANK
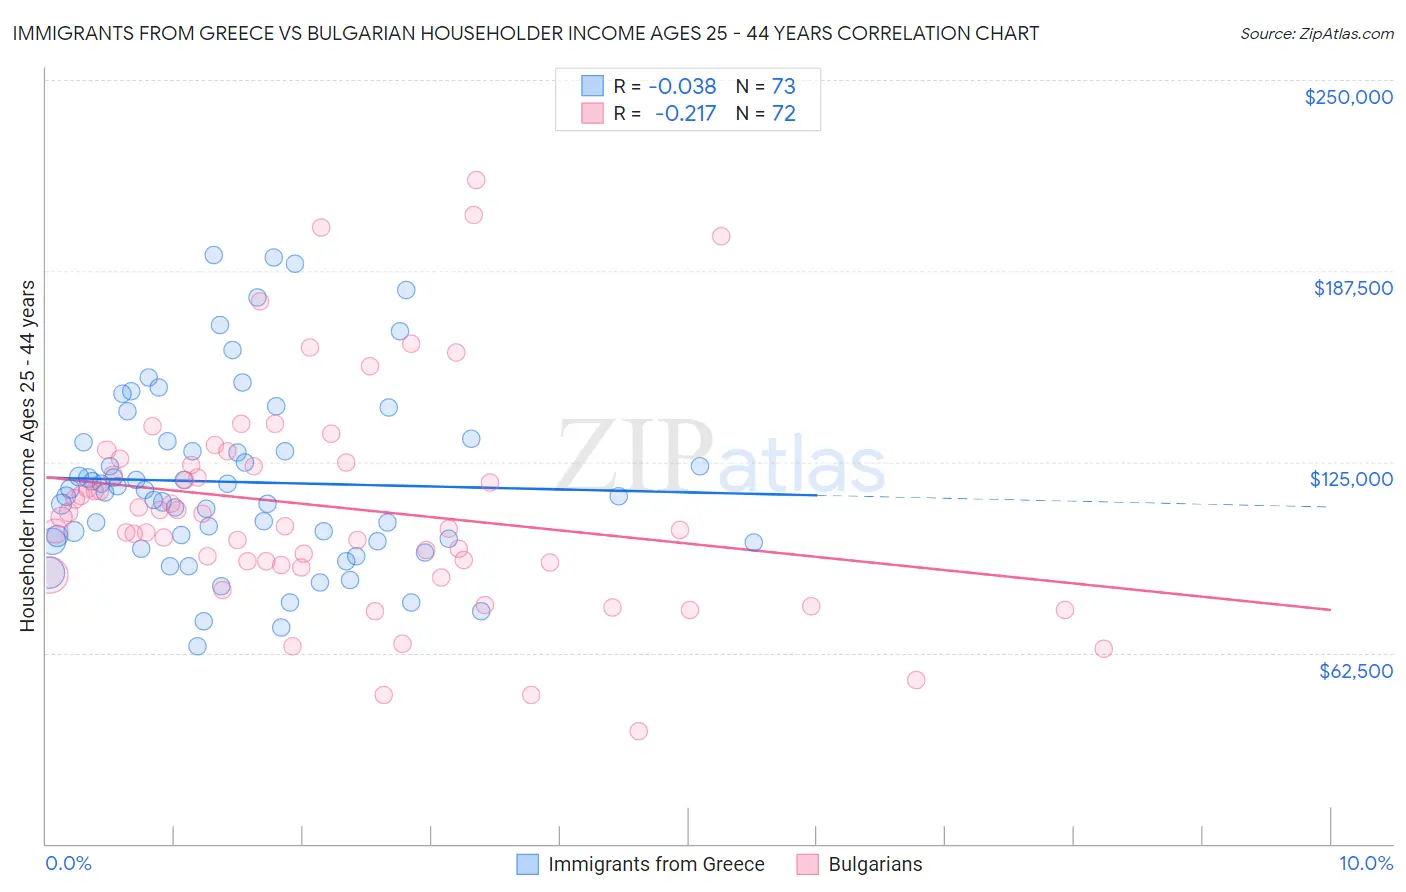
Immigrants from Greece vs Bulgarian Householder Income Ages 25 - 44 years Correlation Chart
The statistical analysis conducted on geographies consisting of 216,436,385 people shows no correlation between the proportion of Immigrants from Greece and household income with householder between the ages 25 and 44 in the United States with a correlation coefficient (R) of -0.038 and weighted average of $110,103. Similarly, the statistical analysis conducted on geographies consisting of 205,263,192 people shows a weak negative correlation between the proportion of Bulgarians and household income with householder between the ages 25 and 44 in the United States with a correlation coefficient (R) of -0.217 and weighted average of $107,264, a difference of 2.6%.
Householder Income Ages 25 - 44 years Correlation Summary
| Measurement | Immigrants from Greece | Bulgarian |
| Minimum | $64,496 | $36,944 |
| Maximum | $192,794 | $217,083 |
| Range | $128,298 | $180,139 |
| Mean | $118,398 | $110,338 |
| Median | $115,021 | $105,369 |
| Interquartile 25% (IQ1) | $99,078 | $91,534 |
| Interquartile 75% (IQ3) | $131,593 | $124,530 |
| Interquartile Range (IQR) | $32,516 | $32,997 |
| Standard Deviation (Sample) | $29,349 | $35,831 |
| Standard Deviation (Population) | $29,147 | $35,581 |
Demographics Similar to Immigrants from Greece and Bulgarians by Householder Income Ages 25 - 44 years
In terms of householder income ages 25 - 44 years, the demographic groups most similar to Immigrants from Greece are Maltese ($110,064, a difference of 0.040%), Turkish ($110,318, a difference of 0.20%), Immigrants from Sri Lanka ($109,741, a difference of 0.33%), Bhutanese ($109,520, a difference of 0.53%), and Bolivian ($109,372, a difference of 0.67%). Similarly, the demographic groups most similar to Bulgarians are Estonian ($107,269, a difference of 0.010%), Immigrants from Turkey ($107,258, a difference of 0.010%), Immigrants from Belarus ($107,393, a difference of 0.12%), Israeli ($107,579, a difference of 0.29%), and Immigrants from Indonesia ($107,627, a difference of 0.34%).
| Demographics | Rating | Rank | Householder Income Ages 25 - 44 years |
| Turks | 100.0 /100 | #29 | Exceptional $110,318 |
| Immigrants | Greece | 100.0 /100 | #30 | Exceptional $110,103 |
| Maltese | 100.0 /100 | #31 | Exceptional $110,064 |
| Immigrants | Sri Lanka | 100.0 /100 | #32 | Exceptional $109,741 |
| Bhutanese | 100.0 /100 | #33 | Exceptional $109,520 |
| Bolivians | 100.0 /100 | #34 | Exceptional $109,372 |
| Immigrants | Switzerland | 100.0 /100 | #35 | Exceptional $109,185 |
| Latvians | 100.0 /100 | #36 | Exceptional $108,926 |
| Immigrants | Russia | 100.0 /100 | #37 | Exceptional $108,751 |
| Soviet Union | 100.0 /100 | #38 | Exceptional $108,457 |
| Immigrants | France | 99.9 /100 | #39 | Exceptional $108,257 |
| Immigrants | Lithuania | 99.9 /100 | #40 | Exceptional $108,149 |
| Immigrants | Bolivia | 99.9 /100 | #41 | Exceptional $108,128 |
| Australians | 99.9 /100 | #42 | Exceptional $107,912 |
| Immigrants | Malaysia | 99.9 /100 | #43 | Exceptional $107,650 |
| Immigrants | Indonesia | 99.9 /100 | #44 | Exceptional $107,627 |
| Israelis | 99.9 /100 | #45 | Exceptional $107,579 |
| Immigrants | Belarus | 99.9 /100 | #46 | Exceptional $107,393 |
| Estonians | 99.9 /100 | #47 | Exceptional $107,269 |
| Bulgarians | 99.9 /100 | #48 | Exceptional $107,264 |
| Immigrants | Turkey | 99.9 /100 | #49 | Exceptional $107,258 |