Immigrants from France vs Cuban Median Household Income
COMPARE
Immigrants from France
Cuban
Median Household Income
Median Household Income Comparison
Immigrants from France
Cubans
$96,743
MEDIAN HOUSEHOLD INCOME
99.9/ 100
METRIC RATING
43rd/ 347
METRIC RANK
$73,392
MEDIAN HOUSEHOLD INCOME
0.1/ 100
METRIC RATING
295th/ 347
METRIC RANK
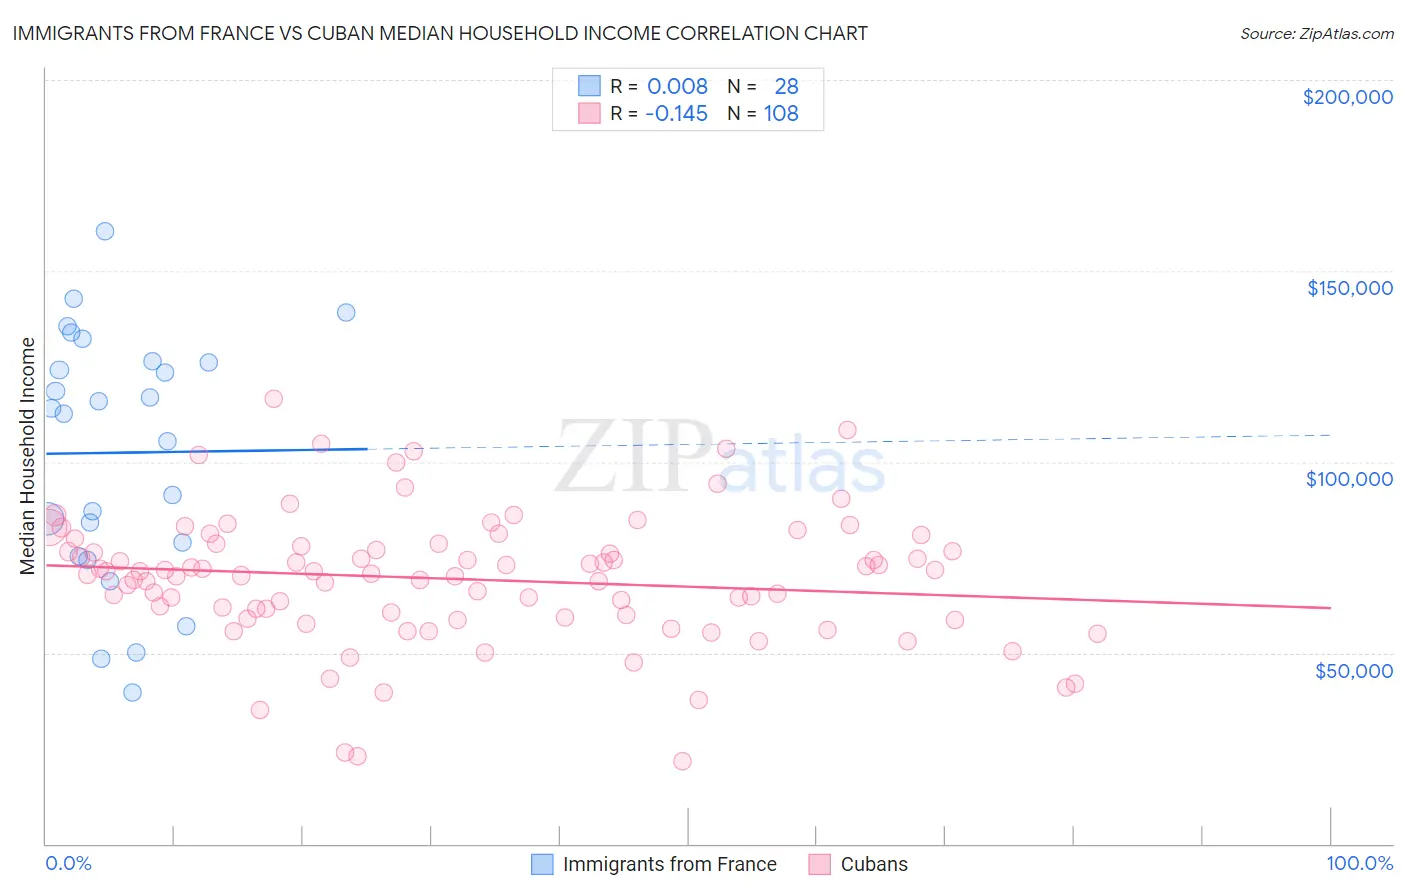
Immigrants from France vs Cuban Median Household Income Correlation Chart
The statistical analysis conducted on geographies consisting of 287,829,118 people shows no correlation between the proportion of Immigrants from France and median household income in the United States with a correlation coefficient (R) of 0.008 and weighted average of $96,743. Similarly, the statistical analysis conducted on geographies consisting of 448,852,866 people shows a poor negative correlation between the proportion of Cubans and median household income in the United States with a correlation coefficient (R) of -0.145 and weighted average of $73,392, a difference of 31.8%.
Median Household Income Correlation Summary
| Measurement | Immigrants from France | Cuban |
| Minimum | $39,667 | $21,567 |
| Maximum | $160,542 | $116,431 |
| Range | $120,875 | $94,864 |
| Mean | $102,392 | $69,339 |
| Median | $113,241 | $70,955 |
| Interquartile 25% (IQ1) | $77,070 | $59,587 |
| Interquartile 75% (IQ3) | $126,188 | $78,118 |
| Interquartile Range (IQR) | $49,118 | $18,531 |
| Standard Deviation (Sample) | $32,282 | $17,087 |
| Standard Deviation (Population) | $31,701 | $17,007 |
Similar Demographics by Median Household Income
Demographics Similar to Immigrants from France by Median Household Income
In terms of median household income, the demographic groups most similar to Immigrants from France are Immigrants from Greece ($96,675, a difference of 0.070%), Immigrants from Lithuania ($96,836, a difference of 0.10%), Israeli ($96,552, a difference of 0.20%), Immigrants from Turkey ($96,964, a difference of 0.23%), and Australian ($96,490, a difference of 0.26%).
| Demographics | Rating | Rank | Median Household Income |
| Immigrants | Pakistan | 100.0 /100 | #36 | Exceptional $97,528 |
| Latvians | 100.0 /100 | #37 | Exceptional $97,311 |
| Immigrants | Indonesia | 100.0 /100 | #38 | Exceptional $97,297 |
| Afghans | 100.0 /100 | #39 | Exceptional $97,026 |
| Maltese | 100.0 /100 | #40 | Exceptional $97,015 |
| Immigrants | Turkey | 100.0 /100 | #41 | Exceptional $96,964 |
| Immigrants | Lithuania | 99.9 /100 | #42 | Exceptional $96,836 |
| Immigrants | France | 99.9 /100 | #43 | Exceptional $96,743 |
| Immigrants | Greece | 99.9 /100 | #44 | Exceptional $96,675 |
| Israelis | 99.9 /100 | #45 | Exceptional $96,552 |
| Australians | 99.9 /100 | #46 | Exceptional $96,490 |
| Immigrants | Russia | 99.9 /100 | #47 | Exceptional $96,378 |
| Cambodians | 99.9 /100 | #48 | Exceptional $96,324 |
| Immigrants | Malaysia | 99.9 /100 | #49 | Exceptional $96,292 |
| Bulgarians | 99.9 /100 | #50 | Exceptional $96,290 |
Demographics Similar to Cubans by Median Household Income
In terms of median household income, the demographic groups most similar to Cubans are Haitian ($73,306, a difference of 0.12%), Blackfeet ($73,509, a difference of 0.16%), Immigrants from Cabo Verde ($73,515, a difference of 0.17%), Immigrants from Mexico ($73,160, a difference of 0.32%), and Comanche ($73,747, a difference of 0.48%).
| Demographics | Rating | Rank | Median Household Income |
| Immigrants | Central America | 0.1 /100 | #288 | Tragic $74,217 |
| Fijians | 0.1 /100 | #289 | Tragic $74,205 |
| Bangladeshis | 0.1 /100 | #290 | Tragic $74,112 |
| Hispanics or Latinos | 0.1 /100 | #291 | Tragic $73,823 |
| Comanche | 0.1 /100 | #292 | Tragic $73,747 |
| Immigrants | Cabo Verde | 0.1 /100 | #293 | Tragic $73,515 |
| Blackfeet | 0.1 /100 | #294 | Tragic $73,509 |
| Cubans | 0.1 /100 | #295 | Tragic $73,392 |
| Haitians | 0.1 /100 | #296 | Tragic $73,306 |
| Immigrants | Mexico | 0.0 /100 | #297 | Tragic $73,160 |
| Paiute | 0.0 /100 | #298 | Tragic $72,959 |
| Indonesians | 0.0 /100 | #299 | Tragic $72,856 |
| Immigrants | Dominica | 0.0 /100 | #300 | Tragic $72,760 |
| Cherokee | 0.0 /100 | #301 | Tragic $72,682 |
| Shoshone | 0.0 /100 | #302 | Tragic $72,660 |