Immigrants from Ethiopia vs Ukrainian Householder Income Under 25 years
COMPARE
Immigrants from Ethiopia
Ukrainian
Householder Income Under 25 years
Householder Income Under 25 years Comparison
Immigrants from Ethiopia
Ukrainians
$53,408
HOUSEHOLDER INCOME UNDER 25 YEARS
95.2/ 100
METRIC RATING
122nd/ 347
METRIC RANK
$53,843
HOUSEHOLDER INCOME UNDER 25 YEARS
98.3/ 100
METRIC RATING
103rd/ 347
METRIC RANK
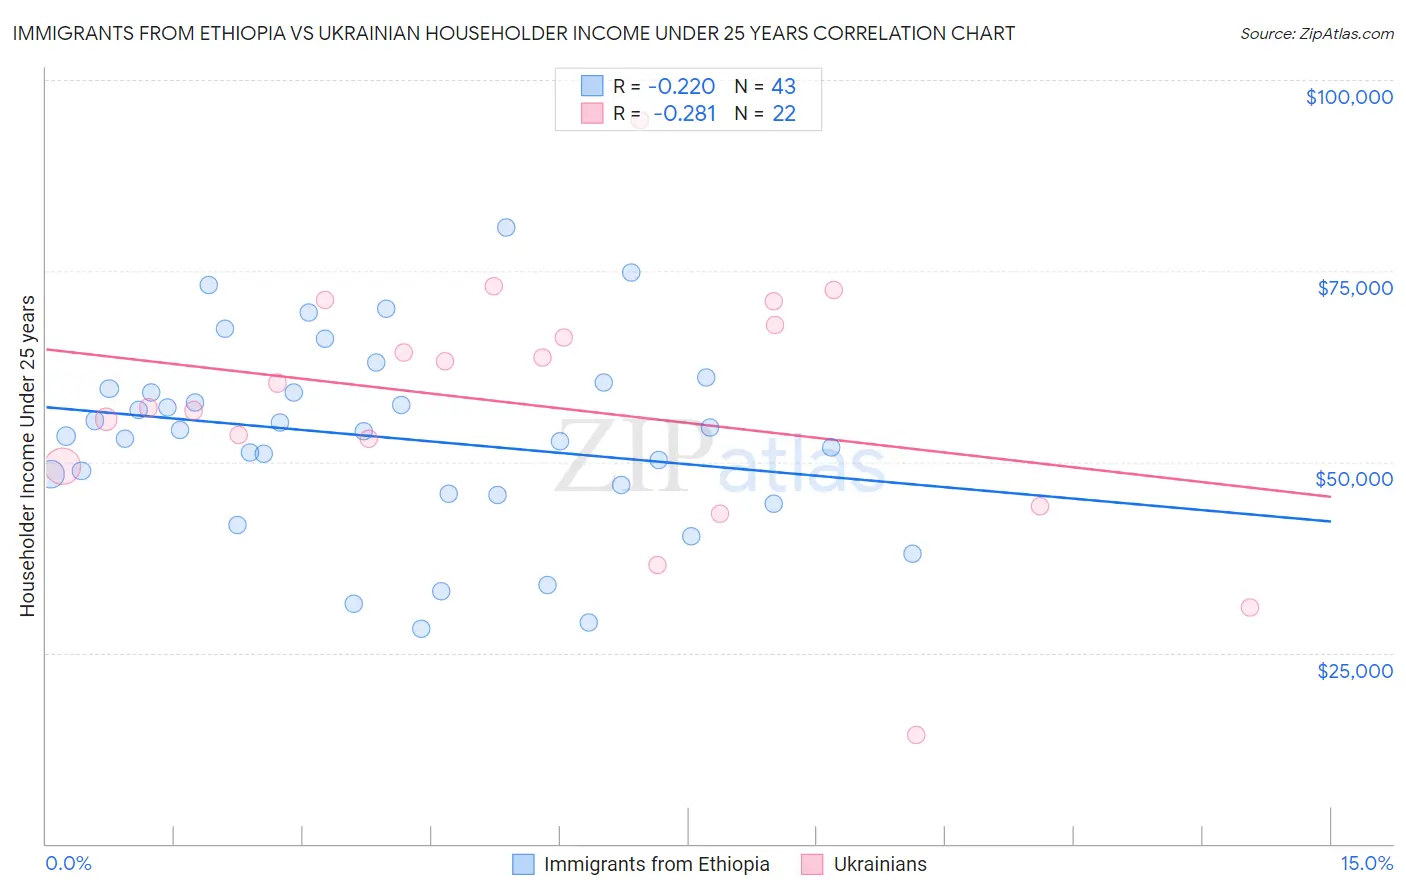
Immigrants from Ethiopia vs Ukrainian Householder Income Under 25 years Correlation Chart
The statistical analysis conducted on geographies consisting of 192,182,425 people shows a weak negative correlation between the proportion of Immigrants from Ethiopia and household income with householder under the age of 25 in the United States with a correlation coefficient (R) of -0.220 and weighted average of $53,408. Similarly, the statistical analysis conducted on geographies consisting of 365,367,408 people shows a weak negative correlation between the proportion of Ukrainians and household income with householder under the age of 25 in the United States with a correlation coefficient (R) of -0.281 and weighted average of $53,843, a difference of 0.81%.
Householder Income Under 25 years Correlation Summary
| Measurement | Immigrants from Ethiopia | Ukrainian |
| Minimum | $28,125 | $14,236 |
| Maximum | $80,609 | $94,821 |
| Range | $52,484 | $80,585 |
| Mean | $53,146 | $57,387 |
| Median | $53,961 | $58,725 |
| Interquartile 25% (IQ1) | $45,759 | $49,424 |
| Interquartile 75% (IQ3) | $59,608 | $67,932 |
| Interquartile Range (IQR) | $13,849 | $18,508 |
| Standard Deviation (Sample) | $12,167 | $16,958 |
| Standard Deviation (Population) | $12,025 | $16,568 |
Demographics Similar to Immigrants from Ethiopia and Ukrainians by Householder Income Under 25 years
In terms of householder income under 25 years, the demographic groups most similar to Immigrants from Ethiopia are Immigrants from Canada ($53,411, a difference of 0.010%), Italian ($53,426, a difference of 0.030%), Guamanian/Chamorro ($53,423, a difference of 0.030%), Immigrants from Switzerland ($53,528, a difference of 0.22%), and Lithuanian ($53,552, a difference of 0.27%). Similarly, the demographic groups most similar to Ukrainians are Ethiopian ($53,818, a difference of 0.050%), Immigrants from France ($53,805, a difference of 0.070%), Albanian ($53,794, a difference of 0.090%), Ecuadorian ($53,911, a difference of 0.13%), and Australian ($53,739, a difference of 0.19%).
| Demographics | Rating | Rank | Householder Income Under 25 years |
| Ecuadorians | 98.5 /100 | #102 | Exceptional $53,911 |
| Ukrainians | 98.3 /100 | #103 | Exceptional $53,843 |
| Ethiopians | 98.2 /100 | #104 | Exceptional $53,818 |
| Immigrants | France | 98.1 /100 | #105 | Exceptional $53,805 |
| Albanians | 98.1 /100 | #106 | Exceptional $53,794 |
| Australians | 97.8 /100 | #107 | Exceptional $53,739 |
| Maltese | 97.8 /100 | #108 | Exceptional $53,735 |
| Immigrants | Ecuador | 97.7 /100 | #109 | Exceptional $53,722 |
| Greeks | 97.7 /100 | #110 | Exceptional $53,715 |
| Immigrants | Colombia | 97.7 /100 | #111 | Exceptional $53,714 |
| Immigrants | Oceania | 97.5 /100 | #112 | Exceptional $53,680 |
| Romanians | 97.2 /100 | #113 | Exceptional $53,632 |
| Immigrants | Sweden | 97.1 /100 | #114 | Exceptional $53,621 |
| Immigrants | Albania | 96.9 /100 | #115 | Exceptional $53,597 |
| Immigrants | Spain | 96.6 /100 | #116 | Exceptional $53,560 |
| Lithuanians | 96.6 /100 | #117 | Exceptional $53,552 |
| Immigrants | Switzerland | 96.3 /100 | #118 | Exceptional $53,528 |
| Italians | 95.4 /100 | #119 | Exceptional $53,426 |
| Guamanians/Chamorros | 95.3 /100 | #120 | Exceptional $53,423 |
| Immigrants | Canada | 95.2 /100 | #121 | Exceptional $53,411 |
| Immigrants | Ethiopia | 95.2 /100 | #122 | Exceptional $53,408 |