Immigrants from Eritrea vs Egyptian Median Household Income
COMPARE
Immigrants from Eritrea
Egyptian
Median Household Income
Median Household Income Comparison
Immigrants from Eritrea
Egyptians
$85,025
MEDIAN HOUSEHOLD INCOME
48.8/ 100
METRIC RATING
177th/ 347
METRIC RANK
$95,673
MEDIAN HOUSEHOLD INCOME
99.9/ 100
METRIC RATING
54th/ 347
METRIC RANK
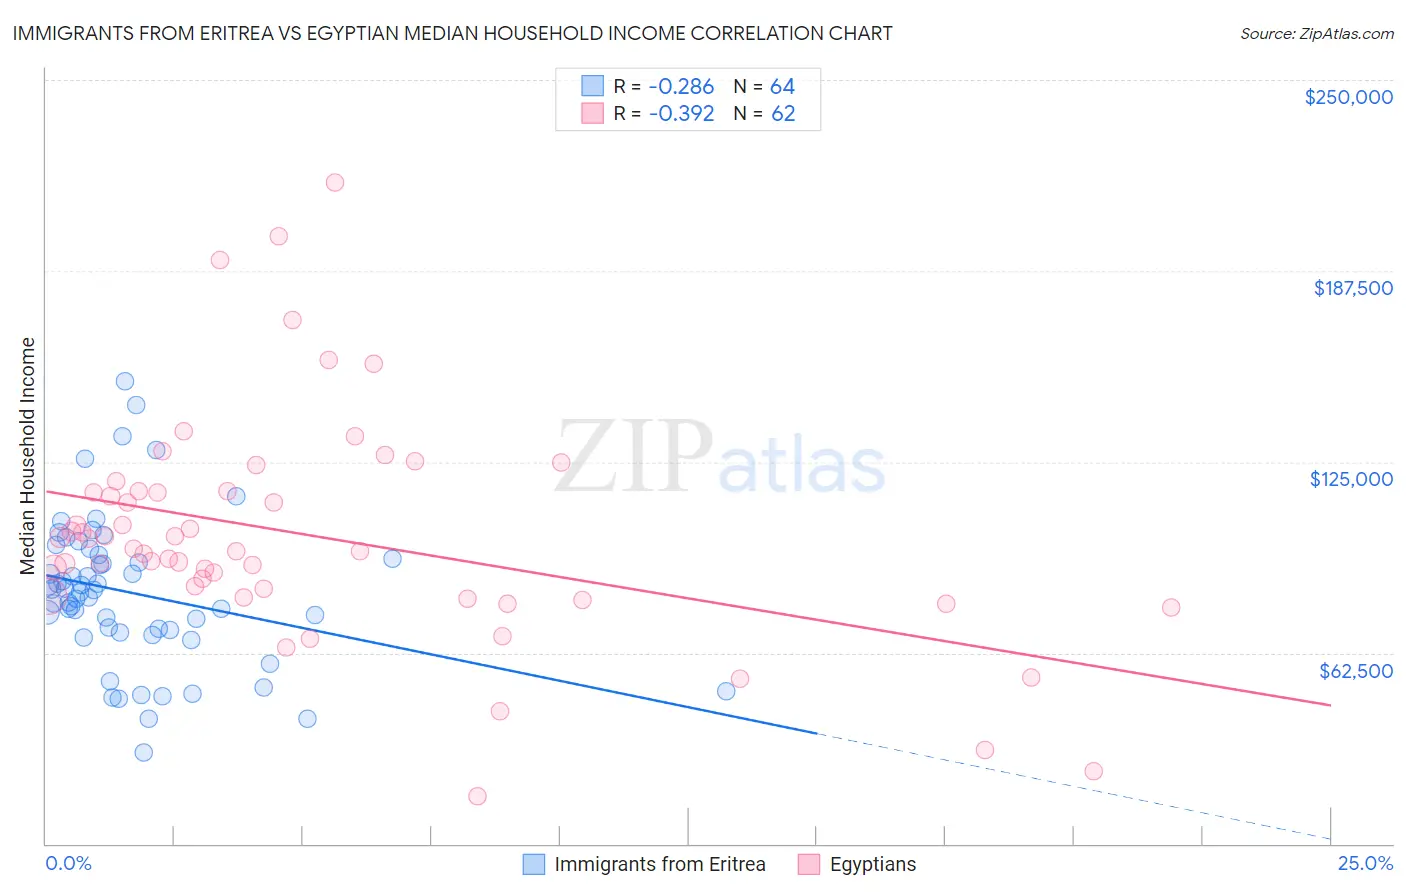
Immigrants from Eritrea vs Egyptian Median Household Income Correlation Chart
The statistical analysis conducted on geographies consisting of 104,846,826 people shows a weak negative correlation between the proportion of Immigrants from Eritrea and median household income in the United States with a correlation coefficient (R) of -0.286 and weighted average of $85,025. Similarly, the statistical analysis conducted on geographies consisting of 276,717,695 people shows a mild negative correlation between the proportion of Egyptians and median household income in the United States with a correlation coefficient (R) of -0.392 and weighted average of $95,673, a difference of 12.5%.
Median Household Income Correlation Summary
| Measurement | Immigrants from Eritrea | Egyptian |
| Minimum | $29,732 | $15,682 |
| Maximum | $151,475 | $216,495 |
| Range | $121,743 | $200,813 |
| Mean | $82,120 | $100,993 |
| Median | $82,729 | $96,117 |
| Interquartile 25% (IQ1) | $69,674 | $81,164 |
| Interquartile 75% (IQ3) | $94,044 | $115,184 |
| Interquartile Range (IQR) | $24,370 | $34,020 |
| Standard Deviation (Sample) | $24,340 | $37,055 |
| Standard Deviation (Population) | $24,149 | $36,755 |
Similar Demographics by Median Household Income
Demographics Similar to Immigrants from Eritrea by Median Household Income
In terms of median household income, the demographic groups most similar to Immigrants from Eritrea are Immigrants from Costa Rica ($85,054, a difference of 0.030%), Alsatian ($85,053, a difference of 0.030%), Czechoslovakian ($84,965, a difference of 0.070%), Scottish ($85,101, a difference of 0.090%), and English ($84,915, a difference of 0.13%).
| Demographics | Rating | Rank | Median Household Income |
| Swiss | 59.2 /100 | #170 | Average $85,681 |
| Immigrants | South America | 58.1 /100 | #171 | Average $85,611 |
| Slovenes | 57.4 /100 | #172 | Average $85,562 |
| Immigrants | Cameroon | 53.4 /100 | #173 | Average $85,314 |
| Scottish | 50.0 /100 | #174 | Average $85,101 |
| Immigrants | Costa Rica | 49.2 /100 | #175 | Average $85,054 |
| Alsatians | 49.2 /100 | #176 | Average $85,053 |
| Immigrants | Eritrea | 48.8 /100 | #177 | Average $85,025 |
| Czechoslovakians | 47.8 /100 | #178 | Average $84,965 |
| English | 47.0 /100 | #179 | Average $84,915 |
| Immigrants | Portugal | 44.2 /100 | #180 | Average $84,740 |
| Hawaiians | 44.1 /100 | #181 | Average $84,729 |
| Uruguayans | 43.5 /100 | #182 | Average $84,691 |
| Spaniards | 42.7 /100 | #183 | Average $84,644 |
| Immigrants | Eastern Africa | 37.4 /100 | #184 | Fair $84,299 |
Demographics Similar to Egyptians by Median Household Income
In terms of median household income, the demographic groups most similar to Egyptians are Paraguayan ($95,737, a difference of 0.070%), Immigrants from South Africa ($95,800, a difference of 0.13%), Estonian ($95,930, a difference of 0.27%), Immigrants from Czechoslovakia ($95,319, a difference of 0.37%), and Immigrants from Austria ($95,277, a difference of 0.42%).
| Demographics | Rating | Rank | Median Household Income |
| Immigrants | Russia | 99.9 /100 | #47 | Exceptional $96,378 |
| Cambodians | 99.9 /100 | #48 | Exceptional $96,324 |
| Immigrants | Malaysia | 99.9 /100 | #49 | Exceptional $96,292 |
| Bulgarians | 99.9 /100 | #50 | Exceptional $96,290 |
| Estonians | 99.9 /100 | #51 | Exceptional $95,930 |
| Immigrants | South Africa | 99.9 /100 | #52 | Exceptional $95,800 |
| Paraguayans | 99.9 /100 | #53 | Exceptional $95,737 |
| Egyptians | 99.9 /100 | #54 | Exceptional $95,673 |
| Immigrants | Czechoslovakia | 99.9 /100 | #55 | Exceptional $95,319 |
| Immigrants | Austria | 99.9 /100 | #56 | Exceptional $95,277 |
| New Zealanders | 99.8 /100 | #57 | Exceptional $95,146 |
| Soviet Union | 99.8 /100 | #58 | Exceptional $95,098 |
| Immigrants | Europe | 99.8 /100 | #59 | Exceptional $95,032 |
| Koreans | 99.8 /100 | #60 | Exceptional $95,018 |
| Laotians | 99.8 /100 | #61 | Exceptional $94,990 |