Immigrants from Dominican Republic vs Immigrants from Sri Lanka Median Household Income
COMPARE
Immigrants from Dominican Republic
Immigrants from Sri Lanka
Median Household Income
Median Household Income Comparison
Immigrants from Dominican Republic
Immigrants from Sri Lanka
$70,208
MEDIAN HOUSEHOLD INCOME
0.0/ 100
METRIC RATING
319th/ 347
METRIC RANK
$99,943
MEDIAN HOUSEHOLD INCOME
100.0/ 100
METRIC RATING
28th/ 347
METRIC RANK
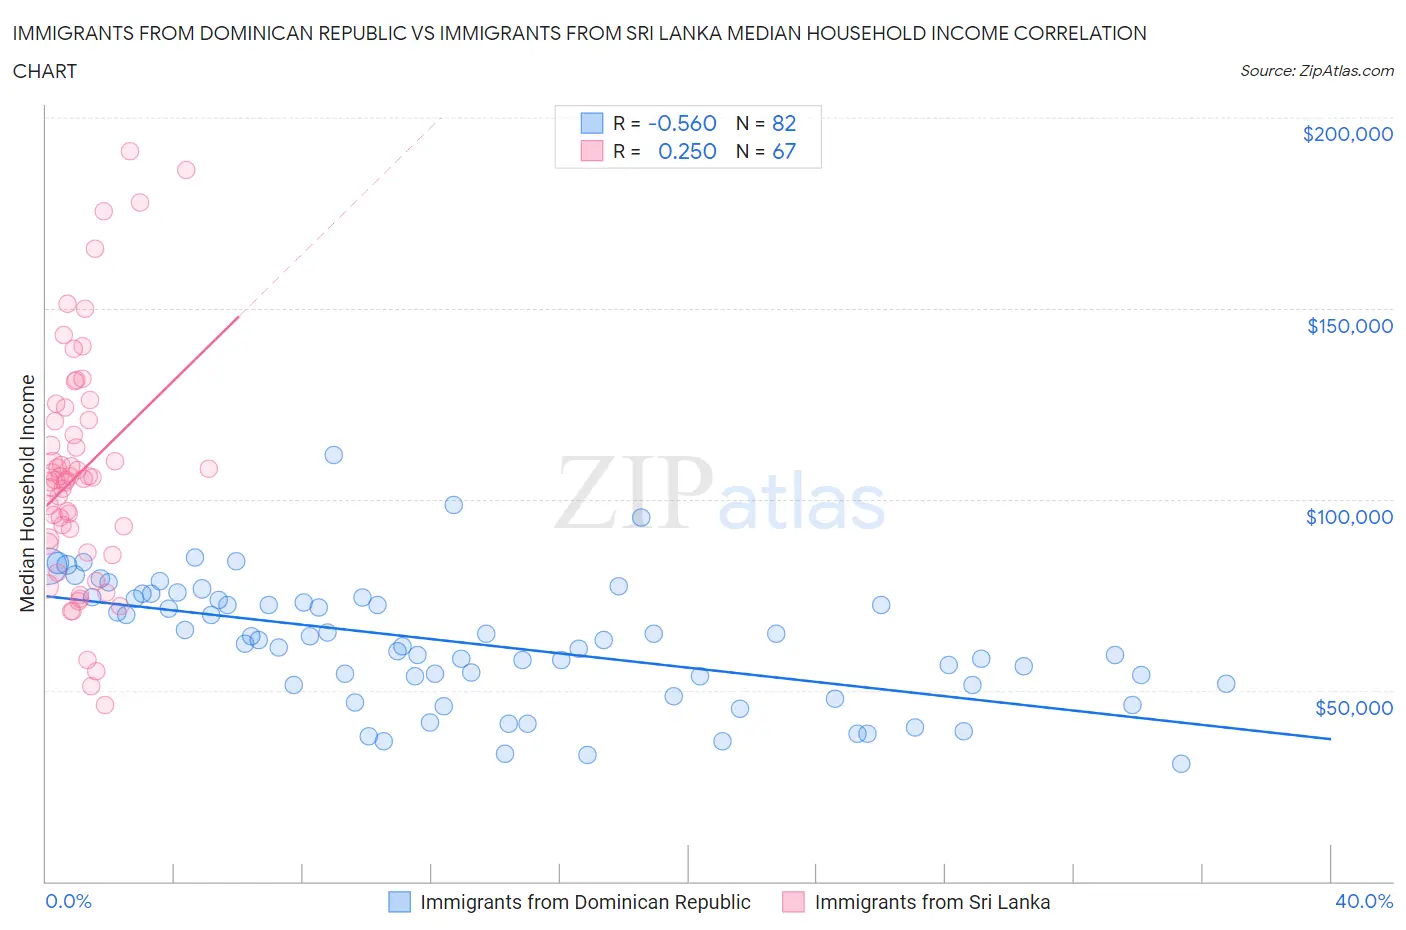
Immigrants from Dominican Republic vs Immigrants from Sri Lanka Median Household Income Correlation Chart
The statistical analysis conducted on geographies consisting of 274,922,738 people shows a substantial negative correlation between the proportion of Immigrants from Dominican Republic and median household income in the United States with a correlation coefficient (R) of -0.560 and weighted average of $70,208. Similarly, the statistical analysis conducted on geographies consisting of 149,648,096 people shows a weak positive correlation between the proportion of Immigrants from Sri Lanka and median household income in the United States with a correlation coefficient (R) of 0.250 and weighted average of $99,943, a difference of 42.3%.
Median Household Income Correlation Summary
| Measurement | Immigrants from Dominican Republic | Immigrants from Sri Lanka |
| Minimum | $30,696 | $46,012 |
| Maximum | $111,701 | $191,184 |
| Range | $81,005 | $145,172 |
| Mean | $62,334 | $106,967 |
| Median | $62,616 | $105,523 |
| Interquartile 25% (IQ1) | $51,486 | $88,285 |
| Interquartile 75% (IQ3) | $74,129 | $120,784 |
| Interquartile Range (IQR) | $22,642 | $32,499 |
| Standard Deviation (Sample) | $16,292 | $30,723 |
| Standard Deviation (Population) | $16,192 | $30,493 |
Similar Demographics by Median Household Income
Demographics Similar to Immigrants from Dominican Republic by Median Household Income
In terms of median household income, the demographic groups most similar to Immigrants from Dominican Republic are Colville ($70,094, a difference of 0.16%), Chickasaw ($70,005, a difference of 0.29%), Choctaw ($69,947, a difference of 0.37%), Chippewa ($70,539, a difference of 0.47%), and Cajun ($70,605, a difference of 0.56%).
| Demographics | Rating | Rank | Median Household Income |
| Immigrants | Honduras | 0.0 /100 | #312 | Tragic $71,452 |
| Immigrants | Bahamas | 0.0 /100 | #313 | Tragic $71,349 |
| Dominicans | 0.0 /100 | #314 | Tragic $71,302 |
| Ottawa | 0.0 /100 | #315 | Tragic $70,984 |
| Apache | 0.0 /100 | #316 | Tragic $70,927 |
| Cajuns | 0.0 /100 | #317 | Tragic $70,605 |
| Chippewa | 0.0 /100 | #318 | Tragic $70,539 |
| Immigrants | Dominican Republic | 0.0 /100 | #319 | Tragic $70,208 |
| Colville | 0.0 /100 | #320 | Tragic $70,094 |
| Chickasaw | 0.0 /100 | #321 | Tragic $70,005 |
| Choctaw | 0.0 /100 | #322 | Tragic $69,947 |
| Bahamians | 0.0 /100 | #323 | Tragic $69,726 |
| Yup'ik | 0.0 /100 | #324 | Tragic $69,695 |
| Seminole | 0.0 /100 | #325 | Tragic $69,420 |
| Yuman | 0.0 /100 | #326 | Tragic $68,743 |
Demographics Similar to Immigrants from Sri Lanka by Median Household Income
In terms of median household income, the demographic groups most similar to Immigrants from Sri Lanka are Immigrants from Asia ($99,933, a difference of 0.010%), Immigrants from Northern Europe ($99,813, a difference of 0.13%), Bhutanese ($100,151, a difference of 0.21%), Immigrants from Belgium ($100,306, a difference of 0.36%), and Turkish ($99,389, a difference of 0.56%).
| Demographics | Rating | Rank | Median Household Income |
| Eastern Europeans | 100.0 /100 | #21 | Exceptional $101,781 |
| Asians | 100.0 /100 | #22 | Exceptional $101,681 |
| Immigrants | Bolivia | 100.0 /100 | #23 | Exceptional $101,394 |
| Immigrants | Japan | 100.0 /100 | #24 | Exceptional $100,711 |
| Immigrants | Sweden | 100.0 /100 | #25 | Exceptional $100,699 |
| Immigrants | Belgium | 100.0 /100 | #26 | Exceptional $100,306 |
| Bhutanese | 100.0 /100 | #27 | Exceptional $100,151 |
| Immigrants | Sri Lanka | 100.0 /100 | #28 | Exceptional $99,943 |
| Immigrants | Asia | 100.0 /100 | #29 | Exceptional $99,933 |
| Immigrants | Northern Europe | 100.0 /100 | #30 | Exceptional $99,813 |
| Turks | 100.0 /100 | #31 | Exceptional $99,389 |
| Immigrants | Denmark | 100.0 /100 | #32 | Exceptional $98,510 |
| Chinese | 100.0 /100 | #33 | Exceptional $98,496 |
| Russians | 100.0 /100 | #34 | Exceptional $98,008 |
| Immigrants | Switzerland | 100.0 /100 | #35 | Exceptional $97,979 |