Immigrants from Czechoslovakia vs Nigerian Median Family Income
COMPARE
Immigrants from Czechoslovakia
Nigerian
Median Family Income
Median Family Income Comparison
Immigrants from Czechoslovakia
Nigerians
$116,165
MEDIAN FAMILY INCOME
99.9/ 100
METRIC RATING
50th/ 347
METRIC RANK
$97,522
MEDIAN FAMILY INCOME
6.7/ 100
METRIC RATING
215th/ 347
METRIC RANK
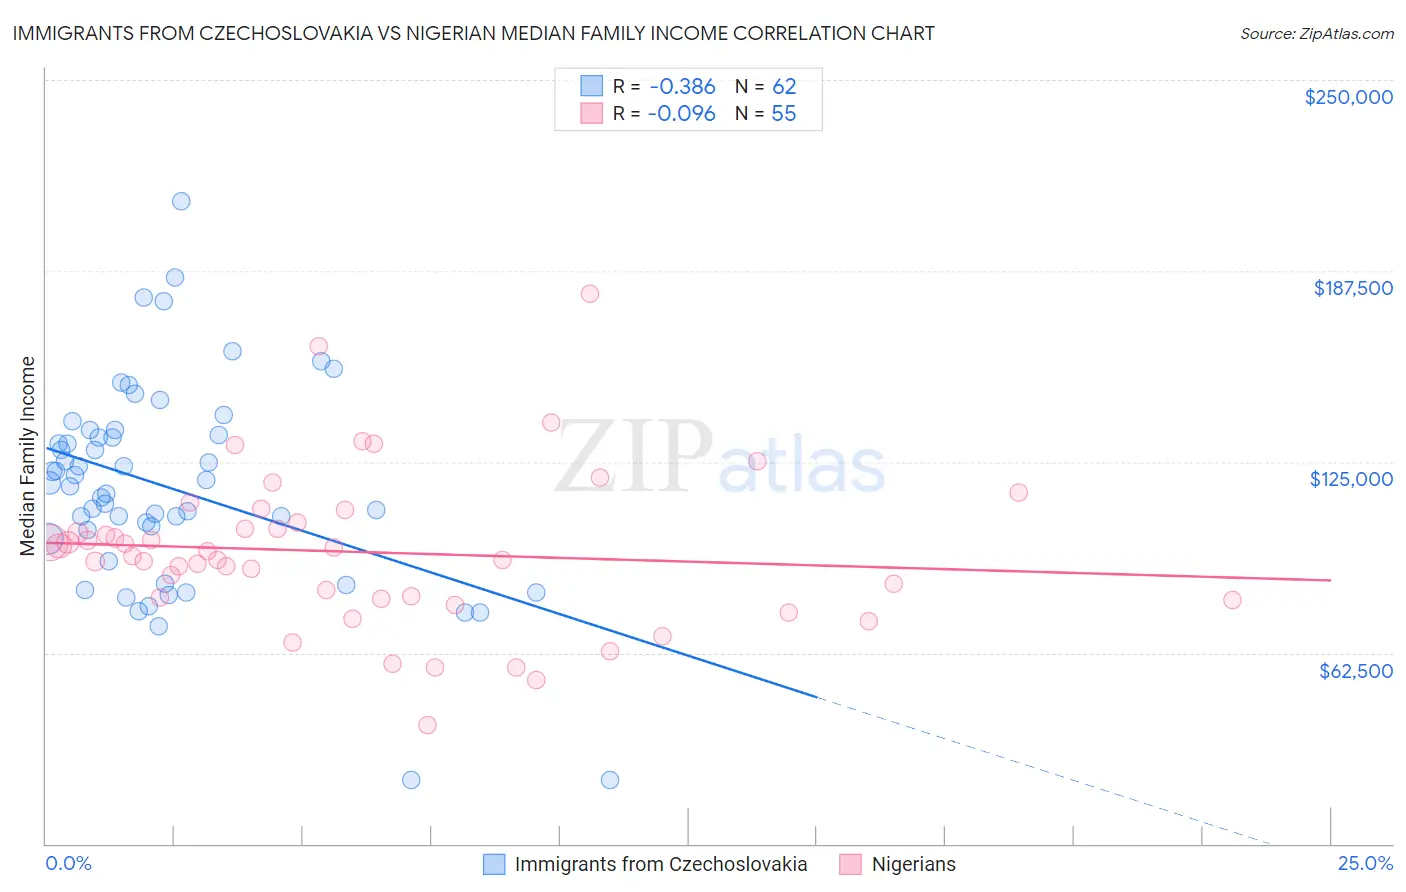
Immigrants from Czechoslovakia vs Nigerian Median Family Income Correlation Chart
The statistical analysis conducted on geographies consisting of 195,434,997 people shows a mild negative correlation between the proportion of Immigrants from Czechoslovakia and median family income in the United States with a correlation coefficient (R) of -0.386 and weighted average of $116,165. Similarly, the statistical analysis conducted on geographies consisting of 332,335,879 people shows a slight negative correlation between the proportion of Nigerians and median family income in the United States with a correlation coefficient (R) of -0.096 and weighted average of $97,522, a difference of 19.1%.
Median Family Income Correlation Summary
| Measurement | Immigrants from Czechoslovakia | Nigerian |
| Minimum | $20,761 | $38,750 |
| Maximum | $210,139 | $179,905 |
| Range | $189,378 | $141,155 |
| Mean | $116,278 | $95,484 |
| Median | $117,481 | $94,247 |
| Interquartile 25% (IQ1) | $99,688 | $80,166 |
| Interquartile 75% (IQ3) | $133,750 | $105,230 |
| Interquartile Range (IQR) | $34,062 | $25,063 |
| Standard Deviation (Sample) | $34,098 | $25,645 |
| Standard Deviation (Population) | $33,822 | $25,411 |
Similar Demographics by Median Family Income
Demographics Similar to Immigrants from Czechoslovakia by Median Family Income
In terms of median family income, the demographic groups most similar to Immigrants from Czechoslovakia are Chinese ($116,188, a difference of 0.020%), Immigrants from South Africa ($116,286, a difference of 0.10%), Immigrants from Malaysia ($115,880, a difference of 0.25%), Maltese ($115,862, a difference of 0.26%), and Immigrants from Norway ($115,847, a difference of 0.27%).
| Demographics | Rating | Rank | Median Family Income |
| Bulgarians | 100.0 /100 | #43 | Exceptional $117,818 |
| Cambodians | 100.0 /100 | #44 | Exceptional $117,780 |
| Immigrants | Greece | 99.9 /100 | #45 | Exceptional $117,344 |
| Immigrants | Russia | 99.9 /100 | #46 | Exceptional $116,942 |
| Immigrants | Austria | 99.9 /100 | #47 | Exceptional $116,830 |
| Immigrants | South Africa | 99.9 /100 | #48 | Exceptional $116,286 |
| Chinese | 99.9 /100 | #49 | Exceptional $116,188 |
| Immigrants | Czechoslovakia | 99.9 /100 | #50 | Exceptional $116,165 |
| Immigrants | Malaysia | 99.9 /100 | #51 | Exceptional $115,880 |
| Maltese | 99.9 /100 | #52 | Exceptional $115,862 |
| Immigrants | Norway | 99.9 /100 | #53 | Exceptional $115,847 |
| Immigrants | Europe | 99.9 /100 | #54 | Exceptional $115,523 |
| Lithuanians | 99.8 /100 | #55 | Exceptional $115,395 |
| New Zealanders | 99.8 /100 | #56 | Exceptional $115,230 |
| Greeks | 99.8 /100 | #57 | Exceptional $115,192 |
Demographics Similar to Nigerians by Median Family Income
In terms of median family income, the demographic groups most similar to Nigerians are Bermudan ($97,577, a difference of 0.060%), Immigrants from Armenia ($97,605, a difference of 0.090%), Immigrants from Bosnia and Herzegovina ($97,432, a difference of 0.090%), Panamanian ($97,683, a difference of 0.17%), and Immigrants from Sudan ($97,737, a difference of 0.22%).
| Demographics | Rating | Rank | Median Family Income |
| Immigrants | Uruguay | 9.2 /100 | #208 | Tragic $98,205 |
| Immigrants | Colombia | 8.7 /100 | #209 | Tragic $98,067 |
| Puget Sound Salish | 8.2 /100 | #210 | Tragic $97,958 |
| Immigrants | Sudan | 7.4 /100 | #211 | Tragic $97,737 |
| Panamanians | 7.2 /100 | #212 | Tragic $97,683 |
| Immigrants | Armenia | 7.0 /100 | #213 | Tragic $97,605 |
| Bermudans | 6.9 /100 | #214 | Tragic $97,577 |
| Nigerians | 6.7 /100 | #215 | Tragic $97,522 |
| Immigrants | Bosnia and Herzegovina | 6.4 /100 | #216 | Tragic $97,432 |
| Japanese | 6.0 /100 | #217 | Tragic $97,288 |
| Immigrants | Cambodia | 5.8 /100 | #218 | Tragic $97,222 |
| Delaware | 5.1 /100 | #219 | Tragic $96,958 |
| Sudanese | 4.7 /100 | #220 | Tragic $96,783 |
| Immigrants | Ghana | 4.2 /100 | #221 | Tragic $96,544 |
| Immigrants | Nigeria | 4.0 /100 | #222 | Tragic $96,439 |