Immigrants from Czechoslovakia vs Immigrants from Colombia Householder Income Under 25 years
COMPARE
Immigrants from Czechoslovakia
Immigrants from Colombia
Householder Income Under 25 years
Householder Income Under 25 years Comparison
Immigrants from Czechoslovakia
Immigrants from Colombia
$54,352
HOUSEHOLDER INCOME UNDER 25 YEARS
99.5/ 100
METRIC RATING
85th/ 347
METRIC RANK
$53,714
HOUSEHOLDER INCOME UNDER 25 YEARS
97.7/ 100
METRIC RATING
111th/ 347
METRIC RANK
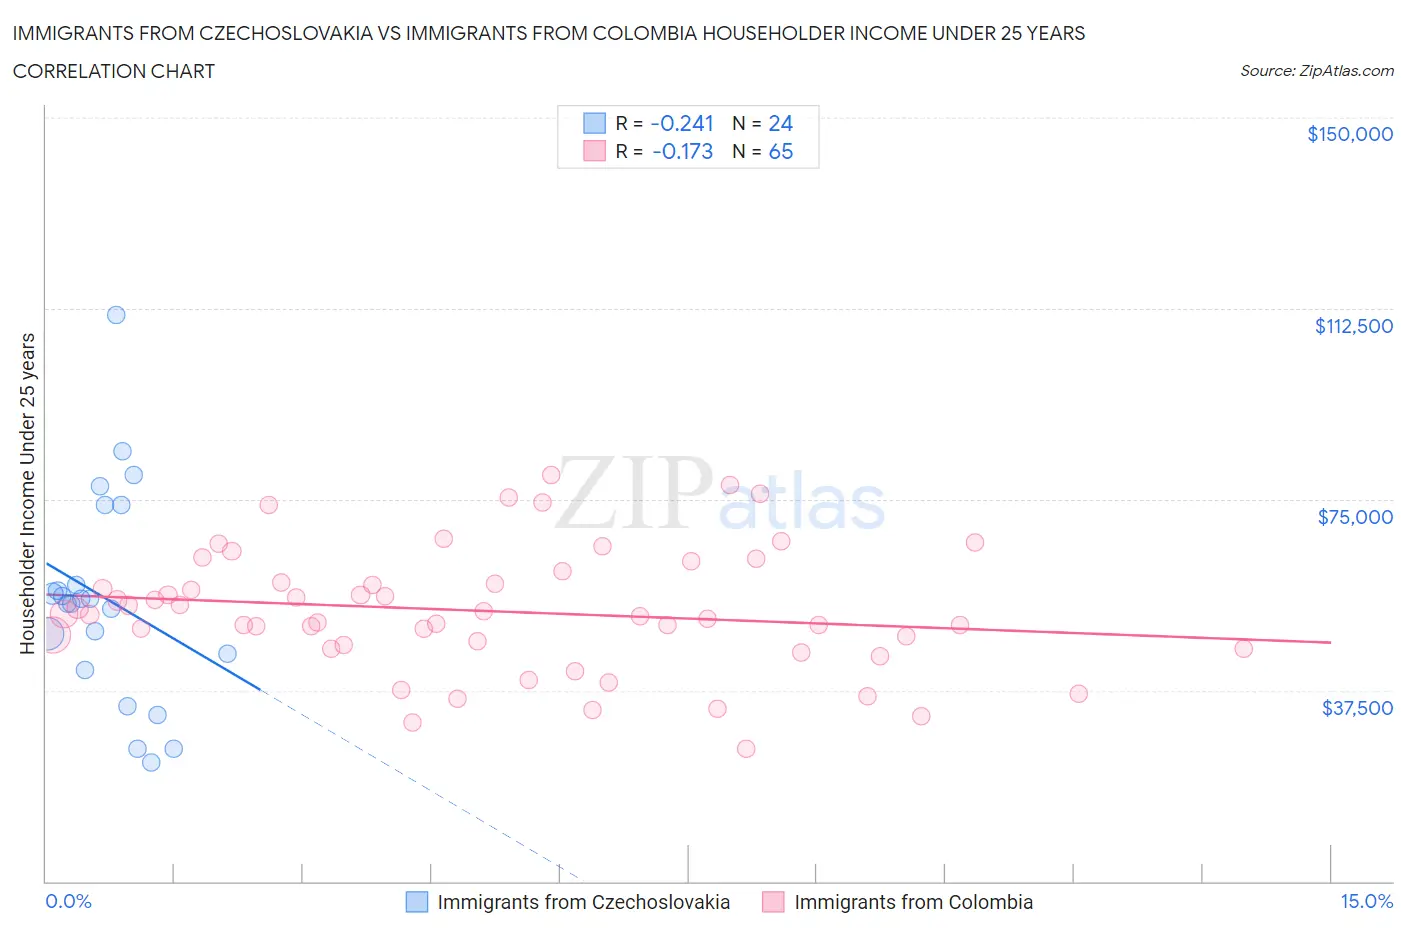
Immigrants from Czechoslovakia vs Immigrants from Colombia Householder Income Under 25 years Correlation Chart
The statistical analysis conducted on geographies consisting of 171,200,377 people shows a weak negative correlation between the proportion of Immigrants from Czechoslovakia and household income with householder under the age of 25 in the United States with a correlation coefficient (R) of -0.241 and weighted average of $54,352. Similarly, the statistical analysis conducted on geographies consisting of 319,710,723 people shows a poor negative correlation between the proportion of Immigrants from Colombia and household income with householder under the age of 25 in the United States with a correlation coefficient (R) of -0.173 and weighted average of $53,714, a difference of 1.2%.
Householder Income Under 25 years Correlation Summary
| Measurement | Immigrants from Czechoslovakia | Immigrants from Colombia |
| Minimum | $23,355 | $26,011 |
| Maximum | $111,159 | $79,746 |
| Range | $87,804 | $53,735 |
| Mean | $55,385 | $53,063 |
| Median | $55,099 | $52,383 |
| Interquartile 25% (IQ1) | $43,094 | $46,106 |
| Interquartile 75% (IQ3) | $66,086 | $59,736 |
| Interquartile Range (IQR) | $22,993 | $13,629 |
| Standard Deviation (Sample) | $20,684 | $12,053 |
| Standard Deviation (Population) | $20,249 | $11,960 |
Similar Demographics by Householder Income Under 25 years
Demographics Similar to Immigrants from Czechoslovakia by Householder Income Under 25 years
In terms of householder income under 25 years, the demographic groups most similar to Immigrants from Czechoslovakia are Bulgarian ($54,352, a difference of 0.0%), Immigrants from Croatia ($54,343, a difference of 0.020%), Laotian ($54,369, a difference of 0.030%), Brazilian ($54,335, a difference of 0.030%), and Yakama ($54,321, a difference of 0.060%).
| Demographics | Rating | Rank | Householder Income Under 25 years |
| Nepalese | 99.6 /100 | #78 | Exceptional $54,472 |
| Immigrants | Italy | 99.6 /100 | #79 | Exceptional $54,449 |
| Egyptians | 99.6 /100 | #80 | Exceptional $54,444 |
| Portuguese | 99.6 /100 | #81 | Exceptional $54,436 |
| Russians | 99.5 /100 | #82 | Exceptional $54,389 |
| Laotians | 99.5 /100 | #83 | Exceptional $54,369 |
| Bulgarians | 99.5 /100 | #84 | Exceptional $54,352 |
| Immigrants | Czechoslovakia | 99.5 /100 | #85 | Exceptional $54,352 |
| Immigrants | Croatia | 99.5 /100 | #86 | Exceptional $54,343 |
| Brazilians | 99.5 /100 | #87 | Exceptional $54,335 |
| Yakama | 99.5 /100 | #88 | Exceptional $54,321 |
| Immigrants | South America | 99.4 /100 | #89 | Exceptional $54,268 |
| Turks | 99.4 /100 | #90 | Exceptional $54,266 |
| Immigrants | Egypt | 99.3 /100 | #91 | Exceptional $54,239 |
| Immigrants | St. Vincent and the Grenadines | 99.3 /100 | #92 | Exceptional $54,230 |
Demographics Similar to Immigrants from Colombia by Householder Income Under 25 years
In terms of householder income under 25 years, the demographic groups most similar to Immigrants from Colombia are Greek ($53,715, a difference of 0.0%), Immigrants from Ecuador ($53,722, a difference of 0.010%), Maltese ($53,735, a difference of 0.040%), Australian ($53,739, a difference of 0.050%), and Immigrants from Oceania ($53,680, a difference of 0.060%).
| Demographics | Rating | Rank | Householder Income Under 25 years |
| Ethiopians | 98.2 /100 | #104 | Exceptional $53,818 |
| Immigrants | France | 98.1 /100 | #105 | Exceptional $53,805 |
| Albanians | 98.1 /100 | #106 | Exceptional $53,794 |
| Australians | 97.8 /100 | #107 | Exceptional $53,739 |
| Maltese | 97.8 /100 | #108 | Exceptional $53,735 |
| Immigrants | Ecuador | 97.7 /100 | #109 | Exceptional $53,722 |
| Greeks | 97.7 /100 | #110 | Exceptional $53,715 |
| Immigrants | Colombia | 97.7 /100 | #111 | Exceptional $53,714 |
| Immigrants | Oceania | 97.5 /100 | #112 | Exceptional $53,680 |
| Romanians | 97.2 /100 | #113 | Exceptional $53,632 |
| Immigrants | Sweden | 97.1 /100 | #114 | Exceptional $53,621 |
| Immigrants | Albania | 96.9 /100 | #115 | Exceptional $53,597 |
| Immigrants | Spain | 96.6 /100 | #116 | Exceptional $53,560 |
| Lithuanians | 96.6 /100 | #117 | Exceptional $53,552 |
| Immigrants | Switzerland | 96.3 /100 | #118 | Exceptional $53,528 |