Immigrants from Chile vs Samoan Householder Income Ages 45 - 64 years
COMPARE
Immigrants from Chile
Samoan
Householder Income Ages 45 - 64 years
Householder Income Ages 45 - 64 years Comparison
Immigrants from Chile
Samoans
$103,412
HOUSEHOLDER INCOME AGES 45 - 64 YEARS
82.5/ 100
METRIC RATING
146th/ 347
METRIC RANK
$101,580
HOUSEHOLDER INCOME AGES 45 - 64 YEARS
65.3/ 100
METRIC RATING
166th/ 347
METRIC RANK
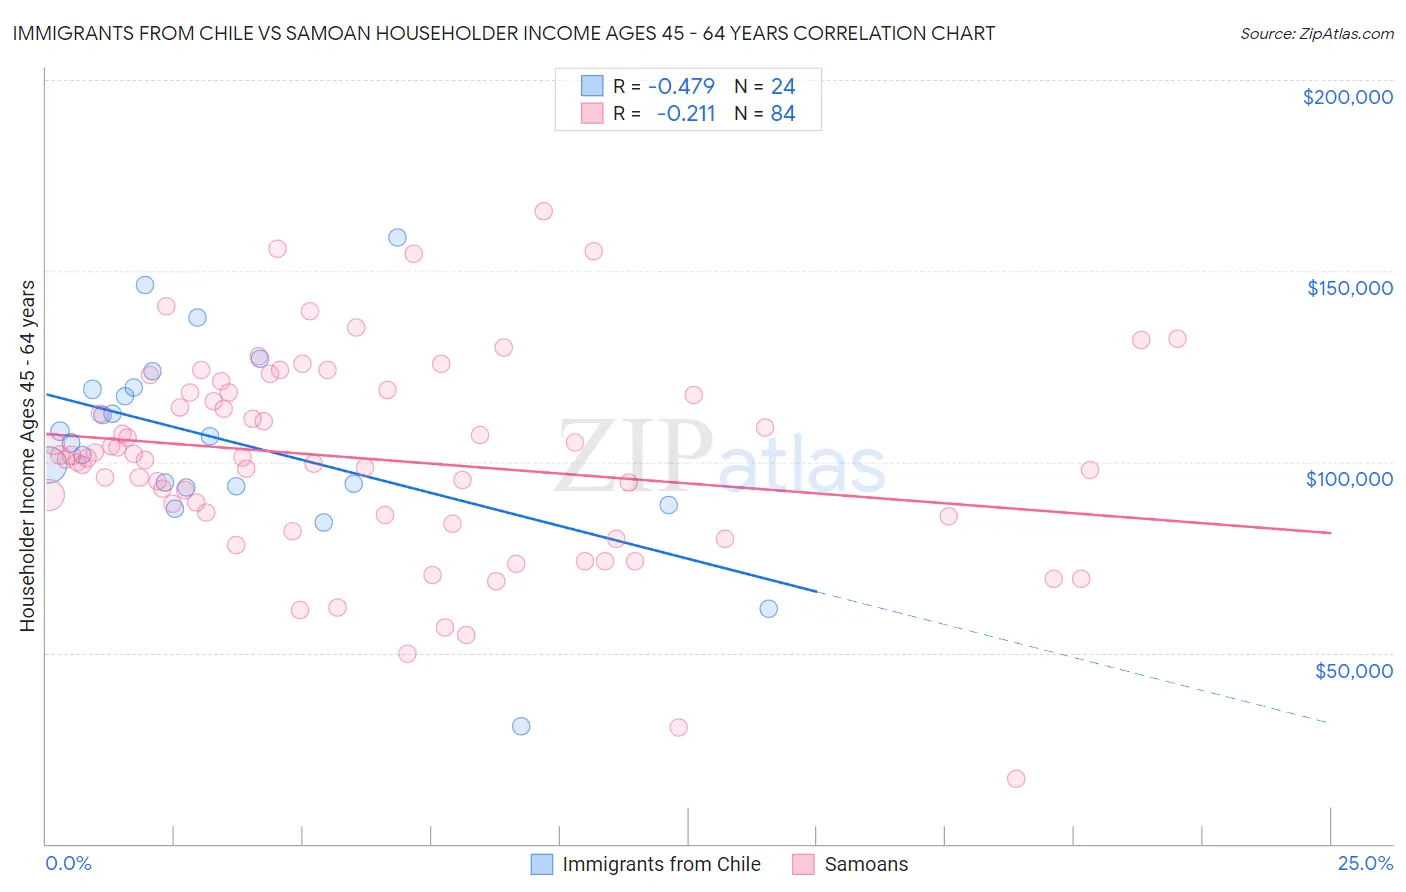
Immigrants from Chile vs Samoan Householder Income Ages 45 - 64 years Correlation Chart
The statistical analysis conducted on geographies consisting of 218,523,915 people shows a moderate negative correlation between the proportion of Immigrants from Chile and household income with householder between the ages 45 and 64 in the United States with a correlation coefficient (R) of -0.479 and weighted average of $103,412. Similarly, the statistical analysis conducted on geographies consisting of 224,959,731 people shows a weak negative correlation between the proportion of Samoans and household income with householder between the ages 45 and 64 in the United States with a correlation coefficient (R) of -0.211 and weighted average of $101,580, a difference of 1.8%.
Householder Income Ages 45 - 64 years Correlation Summary
| Measurement | Immigrants from Chile | Samoan |
| Minimum | $30,865 | $16,995 |
| Maximum | $158,750 | $165,714 |
| Range | $127,885 | $148,719 |
| Mean | $105,152 | $100,718 |
| Median | $105,926 | $101,006 |
| Interquartile 25% (IQ1) | $93,461 | $85,977 |
| Interquartile 75% (IQ3) | $119,302 | $118,111 |
| Interquartile Range (IQR) | $25,840 | $32,135 |
| Standard Deviation (Sample) | $26,462 | $26,759 |
| Standard Deviation (Population) | $25,904 | $26,599 |
Demographics Similar to Immigrants from Chile and Samoans by Householder Income Ages 45 - 64 years
In terms of householder income ages 45 - 64 years, the demographic groups most similar to Immigrants from Chile are Basque ($103,387, a difference of 0.020%), Immigrants from Germany ($103,282, a difference of 0.13%), Immigrants from Sierra Leone ($103,227, a difference of 0.18%), Immigrants from Peru ($103,173, a difference of 0.23%), and Swiss ($103,071, a difference of 0.33%). Similarly, the demographic groups most similar to Samoans are Immigrants from Albania ($101,957, a difference of 0.37%), English ($102,021, a difference of 0.43%), Immigrants from Morocco ($102,015, a difference of 0.43%), Scottish ($102,123, a difference of 0.53%), and Immigrants from Nepal ($102,190, a difference of 0.60%).
| Demographics | Rating | Rank | Householder Income Ages 45 - 64 years |
| Immigrants | Chile | 82.5 /100 | #146 | Excellent $103,412 |
| Basques | 82.3 /100 | #147 | Excellent $103,387 |
| Immigrants | Germany | 81.5 /100 | #148 | Excellent $103,282 |
| Immigrants | Sierra Leone | 81.1 /100 | #149 | Excellent $103,227 |
| Immigrants | Peru | 80.7 /100 | #150 | Excellent $103,173 |
| Swiss | 79.9 /100 | #151 | Good $103,071 |
| Irish | 79.8 /100 | #152 | Good $103,067 |
| Scandinavians | 79.0 /100 | #153 | Good $102,969 |
| Slovenes | 78.3 /100 | #154 | Good $102,885 |
| Costa Ricans | 77.4 /100 | #155 | Good $102,779 |
| Carpatho Rusyns | 77.4 /100 | #156 | Good $102,777 |
| Immigrants | Ethiopia | 77.3 /100 | #157 | Good $102,763 |
| Slavs | 76.1 /100 | #158 | Good $102,629 |
| Sierra Leoneans | 74.2 /100 | #159 | Good $102,427 |
| Icelanders | 72.5 /100 | #160 | Good $102,261 |
| Immigrants | Nepal | 71.8 /100 | #161 | Good $102,190 |
| Scottish | 71.1 /100 | #162 | Good $102,123 |
| English | 70.1 /100 | #163 | Good $102,021 |
| Immigrants | Morocco | 70.0 /100 | #164 | Good $102,015 |
| Immigrants | Albania | 69.4 /100 | #165 | Good $101,957 |
| Samoans | 65.3 /100 | #166 | Good $101,580 |