Immigrants from Caribbean vs Immigrants from Norway Householder Income Under 25 years
COMPARE
Immigrants from Caribbean
Immigrants from Norway
Householder Income Under 25 years
Householder Income Under 25 years Comparison
Immigrants from Caribbean
Immigrants from Norway
$50,757
HOUSEHOLDER INCOME UNDER 25 YEARS
2.9/ 100
METRIC RATING
239th/ 347
METRIC RANK
$50,984
HOUSEHOLDER INCOME UNDER 25 YEARS
5.0/ 100
METRIC RATING
228th/ 347
METRIC RANK
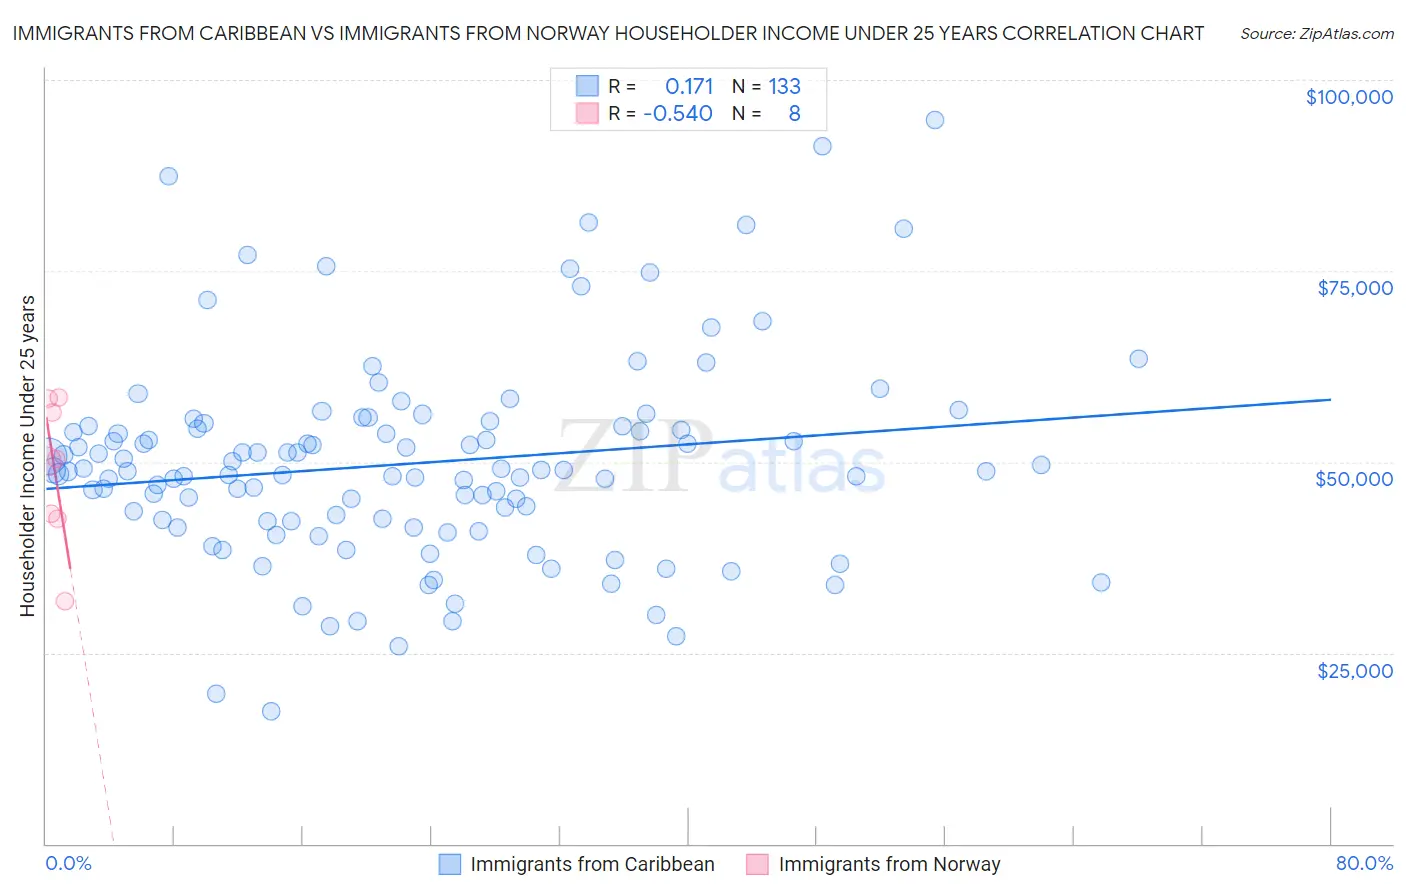
Immigrants from Caribbean vs Immigrants from Norway Householder Income Under 25 years Correlation Chart
The statistical analysis conducted on geographies consisting of 370,531,179 people shows a poor positive correlation between the proportion of Immigrants from Caribbean and household income with householder under the age of 25 in the United States with a correlation coefficient (R) of 0.171 and weighted average of $50,757. Similarly, the statistical analysis conducted on geographies consisting of 106,558,781 people shows a substantial negative correlation between the proportion of Immigrants from Norway and household income with householder under the age of 25 in the United States with a correlation coefficient (R) of -0.540 and weighted average of $50,984, a difference of 0.45%.
Householder Income Under 25 years Correlation Summary
| Measurement | Immigrants from Caribbean | Immigrants from Norway |
| Minimum | $17,293 | $31,719 |
| Maximum | $94,688 | $58,399 |
| Range | $77,395 | $26,680 |
| Mean | $49,812 | $48,892 |
| Median | $48,839 | $50,242 |
| Interquartile 25% (IQ1) | $42,262 | $42,896 |
| Interquartile 75% (IQ3) | $54,667 | $57,370 |
| Interquartile Range (IQR) | $12,405 | $14,474 |
| Standard Deviation (Sample) | $13,378 | $9,309 |
| Standard Deviation (Population) | $13,327 | $8,708 |
Demographics Similar to Immigrants from Caribbean and Immigrants from Norway by Householder Income Under 25 years
In terms of householder income under 25 years, the demographic groups most similar to Immigrants from Caribbean are Immigrants from Lebanon ($50,729, a difference of 0.050%), English ($50,805, a difference of 0.090%), German ($50,804, a difference of 0.090%), Iraqi ($50,802, a difference of 0.090%), and Kenyan ($50,815, a difference of 0.11%). Similarly, the demographic groups most similar to Immigrants from Norway are Immigrants from Central America ($51,022, a difference of 0.070%), Yugoslavian ($51,028, a difference of 0.090%), Yuman ($50,933, a difference of 0.10%), Immigrants from Jamaica ($51,038, a difference of 0.11%), and Jamaican ($50,929, a difference of 0.11%).
| Demographics | Rating | Rank | Householder Income Under 25 years |
| Serbians | 6.6 /100 | #223 | Tragic $51,106 |
| Belizeans | 6.4 /100 | #224 | Tragic $51,094 |
| Immigrants | Jamaica | 5.6 /100 | #225 | Tragic $51,038 |
| Yugoslavians | 5.5 /100 | #226 | Tragic $51,028 |
| Immigrants | Central America | 5.4 /100 | #227 | Tragic $51,022 |
| Immigrants | Norway | 5.0 /100 | #228 | Tragic $50,984 |
| Yuman | 4.4 /100 | #229 | Tragic $50,933 |
| Jamaicans | 4.4 /100 | #230 | Tragic $50,929 |
| Ugandans | 4.3 /100 | #231 | Tragic $50,923 |
| Slovenes | 4.0 /100 | #232 | Tragic $50,886 |
| Pennsylvania Germans | 3.7 /100 | #233 | Tragic $50,852 |
| Kenyans | 3.3 /100 | #234 | Tragic $50,815 |
| Spanish | 3.3 /100 | #235 | Tragic $50,813 |
| English | 3.3 /100 | #236 | Tragic $50,805 |
| Germans | 3.3 /100 | #237 | Tragic $50,804 |
| Iraqis | 3.2 /100 | #238 | Tragic $50,802 |
| Immigrants | Caribbean | 2.9 /100 | #239 | Tragic $50,757 |
| Immigrants | Lebanon | 2.7 /100 | #240 | Tragic $50,729 |
| Immigrants | Micronesia | 2.5 /100 | #241 | Tragic $50,691 |
| Cubans | 2.3 /100 | #242 | Tragic $50,655 |
| Immigrants | Thailand | 2.2 /100 | #243 | Tragic $50,645 |