Immigrants from Bulgaria vs Immigrants from Korea Householder Income Ages 25 - 44 years
COMPARE
Immigrants from Bulgaria
Immigrants from Korea
Householder Income Ages 25 - 44 years
Householder Income Ages 25 - 44 years Comparison
Immigrants from Bulgaria
Immigrants from Korea
$103,423
HOUSEHOLDER INCOME AGES 25 - 44 YEARS
99.3/ 100
METRIC RATING
78th/ 347
METRIC RANK
$113,401
HOUSEHOLDER INCOME AGES 25 - 44 YEARS
100.0/ 100
METRIC RATING
20th/ 347
METRIC RANK
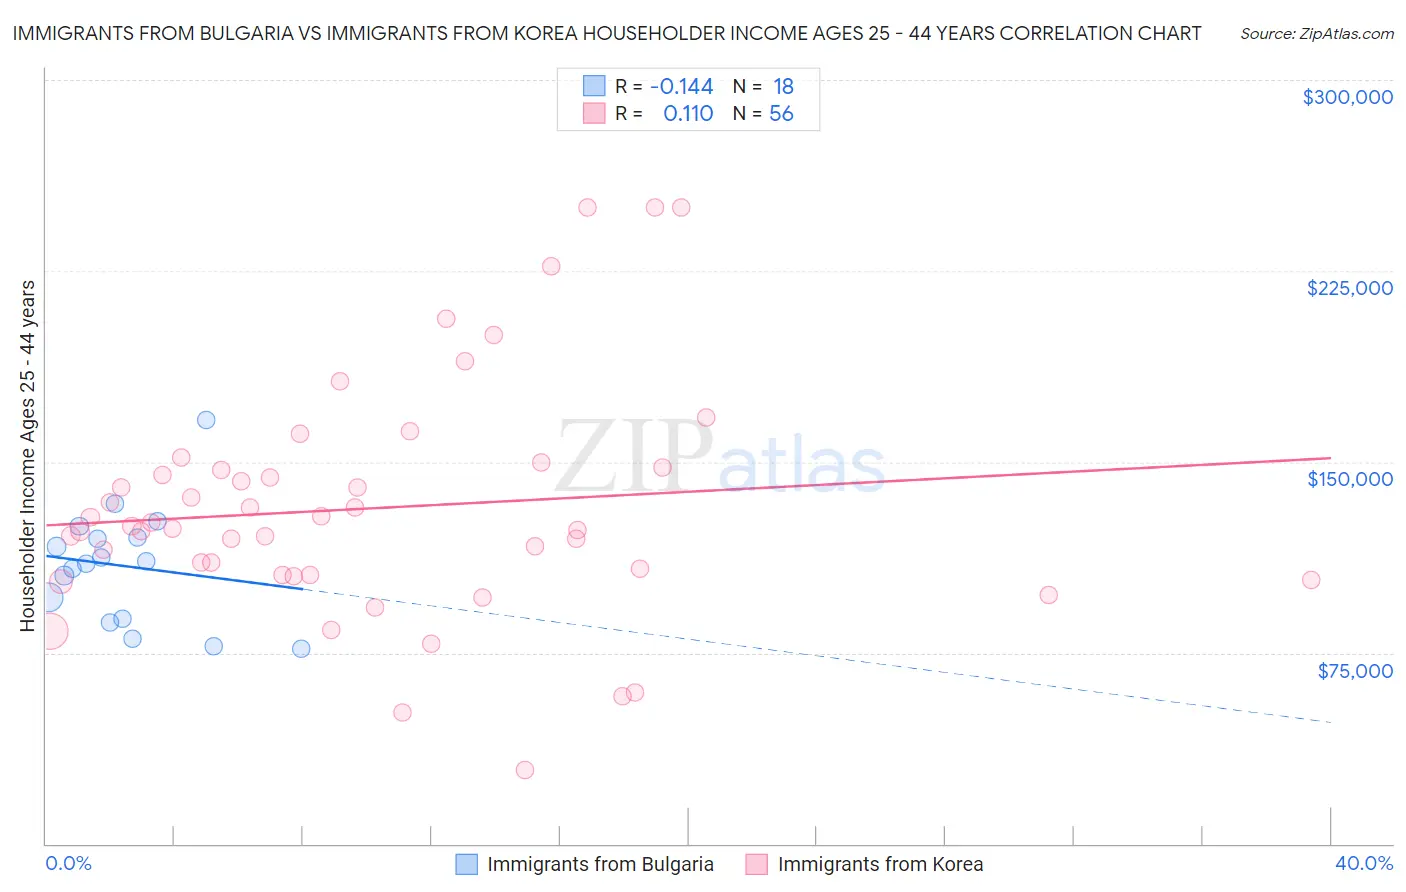
Immigrants from Bulgaria vs Immigrants from Korea Householder Income Ages 25 - 44 years Correlation Chart
The statistical analysis conducted on geographies consisting of 172,413,036 people shows a poor negative correlation between the proportion of Immigrants from Bulgaria and household income with householder between the ages 25 and 44 in the United States with a correlation coefficient (R) of -0.144 and weighted average of $103,423. Similarly, the statistical analysis conducted on geographies consisting of 415,166,266 people shows a poor positive correlation between the proportion of Immigrants from Korea and household income with householder between the ages 25 and 44 in the United States with a correlation coefficient (R) of 0.110 and weighted average of $113,401, a difference of 9.7%.
Householder Income Ages 25 - 44 years Correlation Summary
| Measurement | Immigrants from Bulgaria | Immigrants from Korea |
| Minimum | $76,438 | $29,000 |
| Maximum | $166,675 | $250,001 |
| Range | $90,237 | $221,001 |
| Mean | $109,035 | $131,830 |
| Median | $110,507 | $124,193 |
| Interquartile 25% (IQ1) | $88,575 | $105,598 |
| Interquartile 75% (IQ3) | $120,333 | $147,331 |
| Interquartile Range (IQR) | $31,758 | $41,733 |
| Standard Deviation (Sample) | $22,666 | $46,184 |
| Standard Deviation (Population) | $22,028 | $45,770 |
Similar Demographics by Householder Income Ages 25 - 44 years
Demographics Similar to Immigrants from Bulgaria by Householder Income Ages 25 - 44 years
In terms of householder income ages 25 - 44 years, the demographic groups most similar to Immigrants from Bulgaria are Immigrants from Southern Europe ($103,486, a difference of 0.060%), Armenian ($103,248, a difference of 0.17%), Immigrants from Egypt ($103,192, a difference of 0.22%), South African ($103,160, a difference of 0.25%), and Immigrants from Serbia ($103,155, a difference of 0.26%).
| Demographics | Rating | Rank | Householder Income Ages 25 - 44 years |
| Afghans | 99.6 /100 | #71 | Exceptional $104,410 |
| Chinese | 99.5 /100 | #72 | Exceptional $104,264 |
| Italians | 99.5 /100 | #73 | Exceptional $104,215 |
| Immigrants | Fiji | 99.5 /100 | #74 | Exceptional $103,954 |
| Koreans | 99.4 /100 | #75 | Exceptional $103,824 |
| Immigrants | Spain | 99.4 /100 | #76 | Exceptional $103,752 |
| Immigrants | Southern Europe | 99.3 /100 | #77 | Exceptional $103,486 |
| Immigrants | Bulgaria | 99.3 /100 | #78 | Exceptional $103,423 |
| Armenians | 99.2 /100 | #79 | Exceptional $103,248 |
| Immigrants | Egypt | 99.2 /100 | #80 | Exceptional $103,192 |
| South Africans | 99.2 /100 | #81 | Exceptional $103,160 |
| Immigrants | Serbia | 99.2 /100 | #82 | Exceptional $103,155 |
| Argentineans | 99.1 /100 | #83 | Exceptional $103,111 |
| Immigrants | Philippines | 99.0 /100 | #84 | Exceptional $102,910 |
| Immigrants | Ukraine | 98.9 /100 | #85 | Exceptional $102,664 |
Demographics Similar to Immigrants from Korea by Householder Income Ages 25 - 44 years
In terms of householder income ages 25 - 44 years, the demographic groups most similar to Immigrants from Korea are Burmese ($113,701, a difference of 0.26%), Asian ($112,666, a difference of 0.65%), Immigrants from Belgium ($112,575, a difference of 0.73%), Eastern European ($114,523, a difference of 0.99%), and Immigrants from Japan ($112,228, a difference of 1.1%).
| Demographics | Rating | Rank | Householder Income Ages 25 - 44 years |
| Immigrants | Eastern Asia | 100.0 /100 | #13 | Exceptional $118,056 |
| Immigrants | Israel | 100.0 /100 | #14 | Exceptional $117,219 |
| Immigrants | South Central Asia | 100.0 /100 | #15 | Exceptional $116,626 |
| Cypriots | 100.0 /100 | #16 | Exceptional $116,364 |
| Immigrants | Australia | 100.0 /100 | #17 | Exceptional $115,947 |
| Eastern Europeans | 100.0 /100 | #18 | Exceptional $114,523 |
| Burmese | 100.0 /100 | #19 | Exceptional $113,701 |
| Immigrants | Korea | 100.0 /100 | #20 | Exceptional $113,401 |
| Asians | 100.0 /100 | #21 | Exceptional $112,666 |
| Immigrants | Belgium | 100.0 /100 | #22 | Exceptional $112,575 |
| Immigrants | Japan | 100.0 /100 | #23 | Exceptional $112,228 |
| Immigrants | Sweden | 100.0 /100 | #24 | Exceptional $112,010 |
| Immigrants | Northern Europe | 100.0 /100 | #25 | Exceptional $111,676 |
| Immigrants | Asia | 100.0 /100 | #26 | Exceptional $110,787 |
| Russians | 100.0 /100 | #27 | Exceptional $110,398 |