Immigrants from the Azores vs Immigrants from Bosnia and Herzegovina Householder Income Ages 45 - 64 years
COMPARE
Immigrants from the Azores
Immigrants from Bosnia and Herzegovina
Householder Income Ages 45 - 64 years
Householder Income Ages 45 - 64 years Comparison
Immigrants from the Azores
Immigrants from Bosnia and Herzegovina
$94,138
HOUSEHOLDER INCOME AGES 45 - 64 YEARS
4.3/ 100
METRIC RATING
226th/ 347
METRIC RANK
$94,288
HOUSEHOLDER INCOME AGES 45 - 64 YEARS
4.6/ 100
METRIC RATING
224th/ 347
METRIC RANK
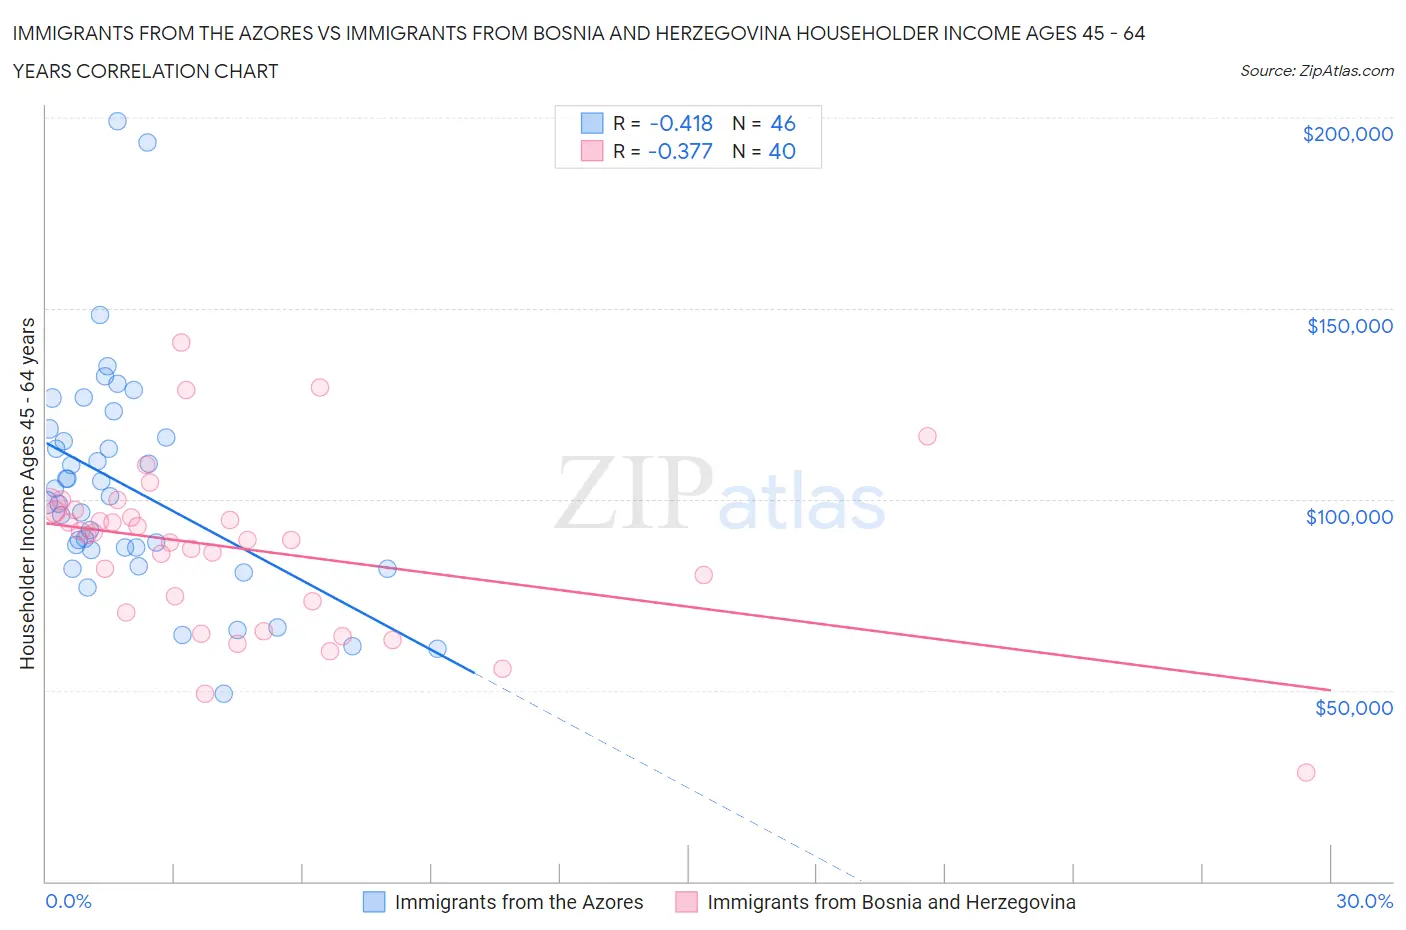
Immigrants from the Azores vs Immigrants from Bosnia and Herzegovina Householder Income Ages 45 - 64 years Correlation Chart
The statistical analysis conducted on geographies consisting of 46,245,378 people shows a moderate negative correlation between the proportion of Immigrants from the Azores and household income with householder between the ages 45 and 64 in the United States with a correlation coefficient (R) of -0.418 and weighted average of $94,138. Similarly, the statistical analysis conducted on geographies consisting of 156,795,002 people shows a mild negative correlation between the proportion of Immigrants from Bosnia and Herzegovina and household income with householder between the ages 45 and 64 in the United States with a correlation coefficient (R) of -0.377 and weighted average of $94,288, a difference of 0.16%.
Householder Income Ages 45 - 64 years Correlation Summary
| Measurement | Immigrants from the Azores | Immigrants from Bosnia and Herzegovina |
| Minimum | $49,083 | $28,542 |
| Maximum | $198,981 | $140,991 |
| Range | $149,898 | $112,449 |
| Mean | $103,017 | $87,003 |
| Median | $100,003 | $90,049 |
| Interquartile 25% (IQ1) | $86,798 | $71,932 |
| Interquartile 75% (IQ3) | $116,103 | $97,030 |
| Interquartile Range (IQR) | $29,305 | $25,098 |
| Standard Deviation (Sample) | $29,838 | $22,077 |
| Standard Deviation (Population) | $29,512 | $21,799 |
Demographics Similar to Immigrants from the Azores and Immigrants from Bosnia and Herzegovina by Householder Income Ages 45 - 64 years
In terms of householder income ages 45 - 64 years, the demographic groups most similar to Immigrants from the Azores are Bermudan ($94,197, a difference of 0.060%), Alaska Native ($93,991, a difference of 0.16%), Nonimmigrants ($94,448, a difference of 0.33%), Immigrants from Panama ($93,815, a difference of 0.34%), and Vietnamese ($93,788, a difference of 0.37%). Similarly, the demographic groups most similar to Immigrants from Bosnia and Herzegovina are Bermudan ($94,197, a difference of 0.10%), Nonimmigrants ($94,448, a difference of 0.17%), Malaysian ($94,517, a difference of 0.24%), Alaska Native ($93,991, a difference of 0.32%), and Immigrants from Panama ($93,815, a difference of 0.50%).
| Demographics | Rating | Rank | Householder Income Ages 45 - 64 years |
| Nigerians | 8.2 /100 | #215 | Tragic $95,492 |
| Immigrants | Venezuela | 7.6 /100 | #216 | Tragic $95,342 |
| Immigrants | Ghana | 6.4 /100 | #217 | Tragic $94,982 |
| Delaware | 6.2 /100 | #218 | Tragic $94,914 |
| Immigrants | Armenia | 6.1 /100 | #219 | Tragic $94,863 |
| Salvadorans | 6.0 /100 | #220 | Tragic $94,842 |
| Immigrants | Nigeria | 5.9 /100 | #221 | Tragic $94,804 |
| Malaysians | 5.2 /100 | #222 | Tragic $94,517 |
| Immigrants | Nonimmigrants | 5.0 /100 | #223 | Tragic $94,448 |
| Immigrants | Bosnia and Herzegovina | 4.6 /100 | #224 | Tragic $94,288 |
| Bermudans | 4.4 /100 | #225 | Tragic $94,197 |
| Immigrants | Azores | 4.3 /100 | #226 | Tragic $94,138 |
| Alaska Natives | 4.0 /100 | #227 | Tragic $93,991 |
| Immigrants | Panama | 3.7 /100 | #228 | Tragic $93,815 |
| Vietnamese | 3.6 /100 | #229 | Tragic $93,788 |
| Immigrants | Sudan | 3.6 /100 | #230 | Tragic $93,781 |
| Ecuadorians | 3.6 /100 | #231 | Tragic $93,739 |
| Sudanese | 3.5 /100 | #232 | Tragic $93,718 |
| Nepalese | 3.0 /100 | #233 | Tragic $93,355 |
| Immigrants | El Salvador | 2.7 /100 | #234 | Tragic $93,176 |
| Nicaraguans | 2.0 /100 | #235 | Tragic $92,554 |