Immigrants from Armenia vs Immigrants from Iran Householder Income Over 65 years
COMPARE
Immigrants from Armenia
Immigrants from Iran
Householder Income Over 65 years
Householder Income Over 65 years Comparison
Immigrants from Armenia
Immigrants from Iran
$53,974
HOUSEHOLDER INCOME OVER 65 YEARS
0.1/ 100
METRIC RATING
282nd/ 347
METRIC RANK
$75,081
HOUSEHOLDER INCOME OVER 65 YEARS
100.0/ 100
METRIC RATING
5th/ 347
METRIC RANK
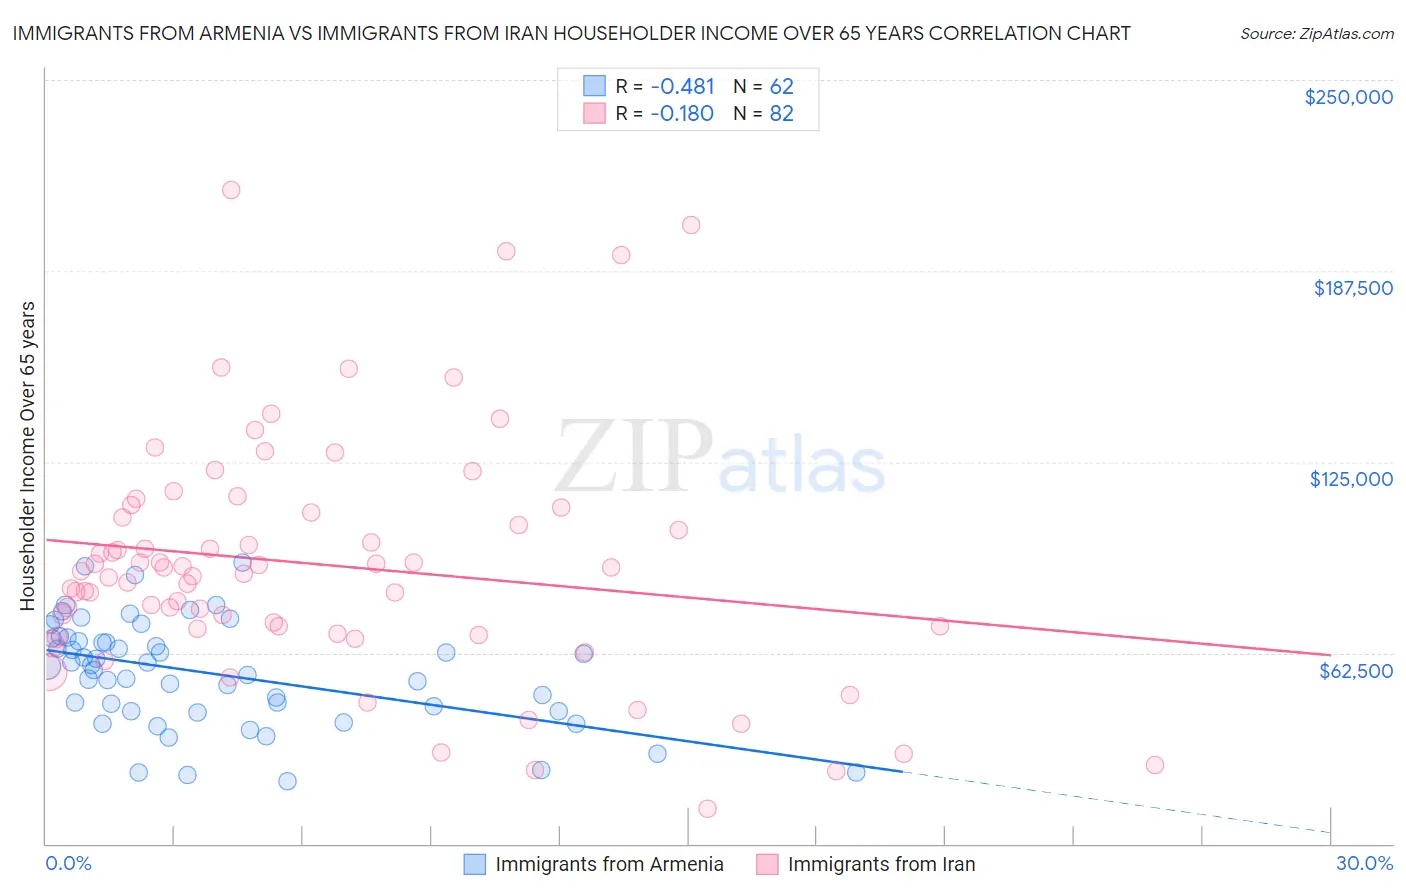
Immigrants from Armenia vs Immigrants from Iran Householder Income Over 65 years Correlation Chart
The statistical analysis conducted on geographies consisting of 97,641,472 people shows a moderate negative correlation between the proportion of Immigrants from Armenia and household income with householder over the age of 65 in the United States with a correlation coefficient (R) of -0.481 and weighted average of $53,974. Similarly, the statistical analysis conducted on geographies consisting of 279,536,688 people shows a poor negative correlation between the proportion of Immigrants from Iran and household income with householder over the age of 65 in the United States with a correlation coefficient (R) of -0.180 and weighted average of $75,081, a difference of 39.1%.
Householder Income Over 65 years Correlation Summary
| Measurement | Immigrants from Armenia | Immigrants from Iran |
| Minimum | $20,326 | $11,563 |
| Maximum | $91,930 | $214,063 |
| Range | $71,604 | $202,500 |
| Mean | $55,908 | $91,354 |
| Median | $58,257 | $88,665 |
| Interquartile 25% (IQ1) | $43,365 | $70,285 |
| Interquartile 75% (IQ3) | $67,262 | $108,269 |
| Interquartile Range (IQR) | $23,897 | $37,985 |
| Standard Deviation (Sample) | $17,185 | $39,442 |
| Standard Deviation (Population) | $17,046 | $39,201 |
Similar Demographics by Householder Income Over 65 years
Demographics Similar to Immigrants from Armenia by Householder Income Over 65 years
In terms of householder income over 65 years, the demographic groups most similar to Immigrants from Armenia are Immigrants from Liberia ($53,967, a difference of 0.010%), Immigrants from Guatemala ($53,950, a difference of 0.040%), Somali ($54,004, a difference of 0.060%), Immigrants from Ecuador ($54,030, a difference of 0.10%), and Blackfeet ($54,029, a difference of 0.10%).
| Demographics | Rating | Rank | Householder Income Over 65 years |
| Cherokee | 0.1 /100 | #275 | Tragic $54,133 |
| Cree | 0.1 /100 | #276 | Tragic $54,129 |
| Cheyenne | 0.1 /100 | #277 | Tragic $54,096 |
| Immigrants | Ecuador | 0.1 /100 | #278 | Tragic $54,030 |
| Blackfeet | 0.1 /100 | #279 | Tragic $54,029 |
| Immigrants | Jamaica | 0.1 /100 | #280 | Tragic $54,027 |
| Somalis | 0.1 /100 | #281 | Tragic $54,004 |
| Immigrants | Armenia | 0.1 /100 | #282 | Tragic $53,974 |
| Immigrants | Liberia | 0.1 /100 | #283 | Tragic $53,967 |
| Immigrants | Guatemala | 0.1 /100 | #284 | Tragic $53,950 |
| Mexicans | 0.1 /100 | #285 | Tragic $53,897 |
| Chippewa | 0.1 /100 | #286 | Tragic $53,847 |
| Immigrants | Barbados | 0.1 /100 | #287 | Tragic $53,766 |
| Paiute | 0.1 /100 | #288 | Tragic $53,762 |
| Iroquois | 0.1 /100 | #289 | Tragic $53,737 |
Demographics Similar to Immigrants from Iran by Householder Income Over 65 years
In terms of householder income over 65 years, the demographic groups most similar to Immigrants from Iran are Bolivian ($74,245, a difference of 1.1%), Filipino ($76,686, a difference of 2.1%), Immigrants from Bolivia ($73,434, a difference of 2.2%), Immigrants from Taiwan ($77,051, a difference of 2.6%), and Immigrants from Singapore ($72,963, a difference of 2.9%).
| Demographics | Rating | Rank | Householder Income Over 65 years |
| Chinese | 100.0 /100 | #1 | Exceptional $77,465 |
| Iranians | 100.0 /100 | #2 | Exceptional $77,429 |
| Immigrants | Taiwan | 100.0 /100 | #3 | Exceptional $77,051 |
| Filipinos | 100.0 /100 | #4 | Exceptional $76,686 |
| Immigrants | Iran | 100.0 /100 | #5 | Exceptional $75,081 |
| Bolivians | 100.0 /100 | #6 | Exceptional $74,245 |
| Immigrants | Bolivia | 100.0 /100 | #7 | Exceptional $73,434 |
| Immigrants | Singapore | 100.0 /100 | #8 | Exceptional $72,963 |
| Immigrants | India | 100.0 /100 | #9 | Exceptional $72,804 |
| Bhutanese | 100.0 /100 | #10 | Exceptional $72,288 |
| Thais | 100.0 /100 | #11 | Exceptional $72,099 |
| Cypriots | 100.0 /100 | #12 | Exceptional $71,714 |
| Immigrants | Hong Kong | 100.0 /100 | #13 | Exceptional $71,567 |
| Burmese | 100.0 /100 | #14 | Exceptional $71,139 |
| Native Hawaiians | 100.0 /100 | #15 | Exceptional $71,021 |