Immigrants from Argentina vs Nepalese Median Family Income
COMPARE
Immigrants from Argentina
Nepalese
Median Family Income
Median Family Income Comparison
Immigrants from Argentina
Nepalese
$110,873
MEDIAN FAMILY INCOME
98.5/ 100
METRIC RATING
89th/ 347
METRIC RANK
$94,153
MEDIAN FAMILY INCOME
1.3/ 100
METRIC RATING
238th/ 347
METRIC RANK
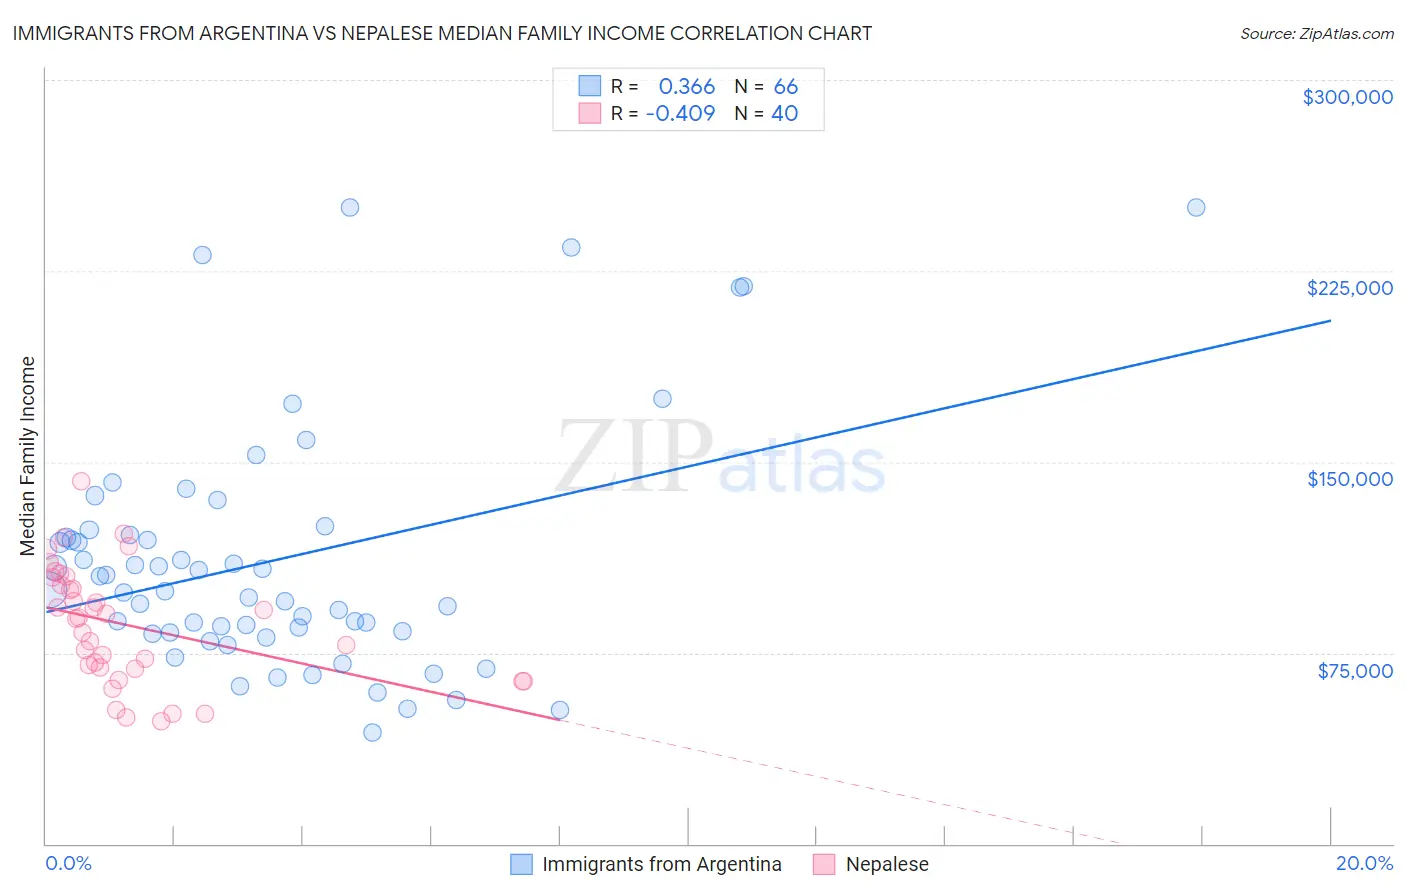
Immigrants from Argentina vs Nepalese Median Family Income Correlation Chart
The statistical analysis conducted on geographies consisting of 264,326,105 people shows a mild positive correlation between the proportion of Immigrants from Argentina and median family income in the United States with a correlation coefficient (R) of 0.366 and weighted average of $110,873. Similarly, the statistical analysis conducted on geographies consisting of 24,521,755 people shows a moderate negative correlation between the proportion of Nepalese and median family income in the United States with a correlation coefficient (R) of -0.409 and weighted average of $94,153, a difference of 17.8%.
Median Family Income Correlation Summary
| Measurement | Immigrants from Argentina | Nepalese |
| Minimum | $43,750 | $47,952 |
| Maximum | $250,001 | $142,416 |
| Range | $206,251 | $94,464 |
| Mean | $111,446 | $85,857 |
| Median | $99,402 | $88,639 |
| Interquartile 25% (IQ1) | $83,128 | $68,953 |
| Interquartile 75% (IQ3) | $121,234 | $103,204 |
| Interquartile Range (IQR) | $38,106 | $34,251 |
| Standard Deviation (Sample) | $47,916 | $22,971 |
| Standard Deviation (Population) | $47,552 | $22,682 |
Similar Demographics by Median Family Income
Demographics Similar to Immigrants from Argentina by Median Family Income
In terms of median family income, the demographic groups most similar to Immigrants from Argentina are Northern European ($110,635, a difference of 0.21%), Immigrants from Southern Europe ($110,614, a difference of 0.23%), Romanian ($111,243, a difference of 0.33%), Austrian ($111,306, a difference of 0.39%), and Croatian ($111,370, a difference of 0.45%).
| Demographics | Rating | Rank | Median Family Income |
| Immigrants | England | 99.2 /100 | #82 | Exceptional $112,038 |
| Immigrants | Egypt | 99.0 /100 | #83 | Exceptional $111,689 |
| Immigrants | Hungary | 98.8 /100 | #84 | Exceptional $111,378 |
| Croatians | 98.8 /100 | #85 | Exceptional $111,370 |
| Ukrainians | 98.8 /100 | #86 | Exceptional $111,368 |
| Austrians | 98.8 /100 | #87 | Exceptional $111,306 |
| Romanians | 98.8 /100 | #88 | Exceptional $111,243 |
| Immigrants | Argentina | 98.5 /100 | #89 | Exceptional $110,873 |
| Northern Europeans | 98.3 /100 | #90 | Exceptional $110,635 |
| Immigrants | Southern Europe | 98.3 /100 | #91 | Exceptional $110,614 |
| Immigrants | Lebanon | 97.9 /100 | #92 | Exceptional $110,159 |
| Immigrants | Kazakhstan | 97.8 /100 | #93 | Exceptional $110,137 |
| Koreans | 97.8 /100 | #94 | Exceptional $110,103 |
| Zimbabweans | 97.7 /100 | #95 | Exceptional $110,011 |
| Immigrants | Moldova | 97.7 /100 | #96 | Exceptional $109,975 |
Demographics Similar to Nepalese by Median Family Income
In terms of median family income, the demographic groups most similar to Nepalese are Salvadoran ($94,109, a difference of 0.050%), Somali ($94,085, a difference of 0.070%), Immigrants from Trinidad and Tobago ($93,988, a difference of 0.17%), Barbadian ($93,919, a difference of 0.25%), and Alaskan Athabascan ($94,429, a difference of 0.29%).
| Demographics | Rating | Rank | Median Family Income |
| Ecuadorians | 2.1 /100 | #231 | Tragic $95,114 |
| Immigrants | Venezuela | 1.9 /100 | #232 | Tragic $94,904 |
| Immigrants | Bangladesh | 1.6 /100 | #233 | Tragic $94,665 |
| Immigrants | Western Africa | 1.6 /100 | #234 | Tragic $94,638 |
| Immigrants | Burma/Myanmar | 1.5 /100 | #235 | Tragic $94,472 |
| Trinidadians and Tobagonians | 1.5 /100 | #236 | Tragic $94,466 |
| Alaskan Athabascans | 1.5 /100 | #237 | Tragic $94,429 |
| Nepalese | 1.3 /100 | #238 | Tragic $94,153 |
| Salvadorans | 1.2 /100 | #239 | Tragic $94,109 |
| Somalis | 1.2 /100 | #240 | Tragic $94,085 |
| Immigrants | Trinidad and Tobago | 1.2 /100 | #241 | Tragic $93,988 |
| Barbadians | 1.1 /100 | #242 | Tragic $93,919 |
| German Russians | 1.1 /100 | #243 | Tragic $93,858 |
| Sub-Saharan Africans | 1.0 /100 | #244 | Tragic $93,748 |
| Immigrants | Middle Africa | 1.0 /100 | #245 | Tragic $93,593 |