Immigrants from Albania vs Dominican Householder Income Over 65 years
COMPARE
Immigrants from Albania
Dominican
Householder Income Over 65 years
Householder Income Over 65 years Comparison
Immigrants from Albania
Dominicans
$57,828
HOUSEHOLDER INCOME OVER 65 YEARS
3.6/ 100
METRIC RATING
228th/ 347
METRIC RANK
$46,964
HOUSEHOLDER INCOME OVER 65 YEARS
0.0/ 100
METRIC RATING
341st/ 347
METRIC RANK
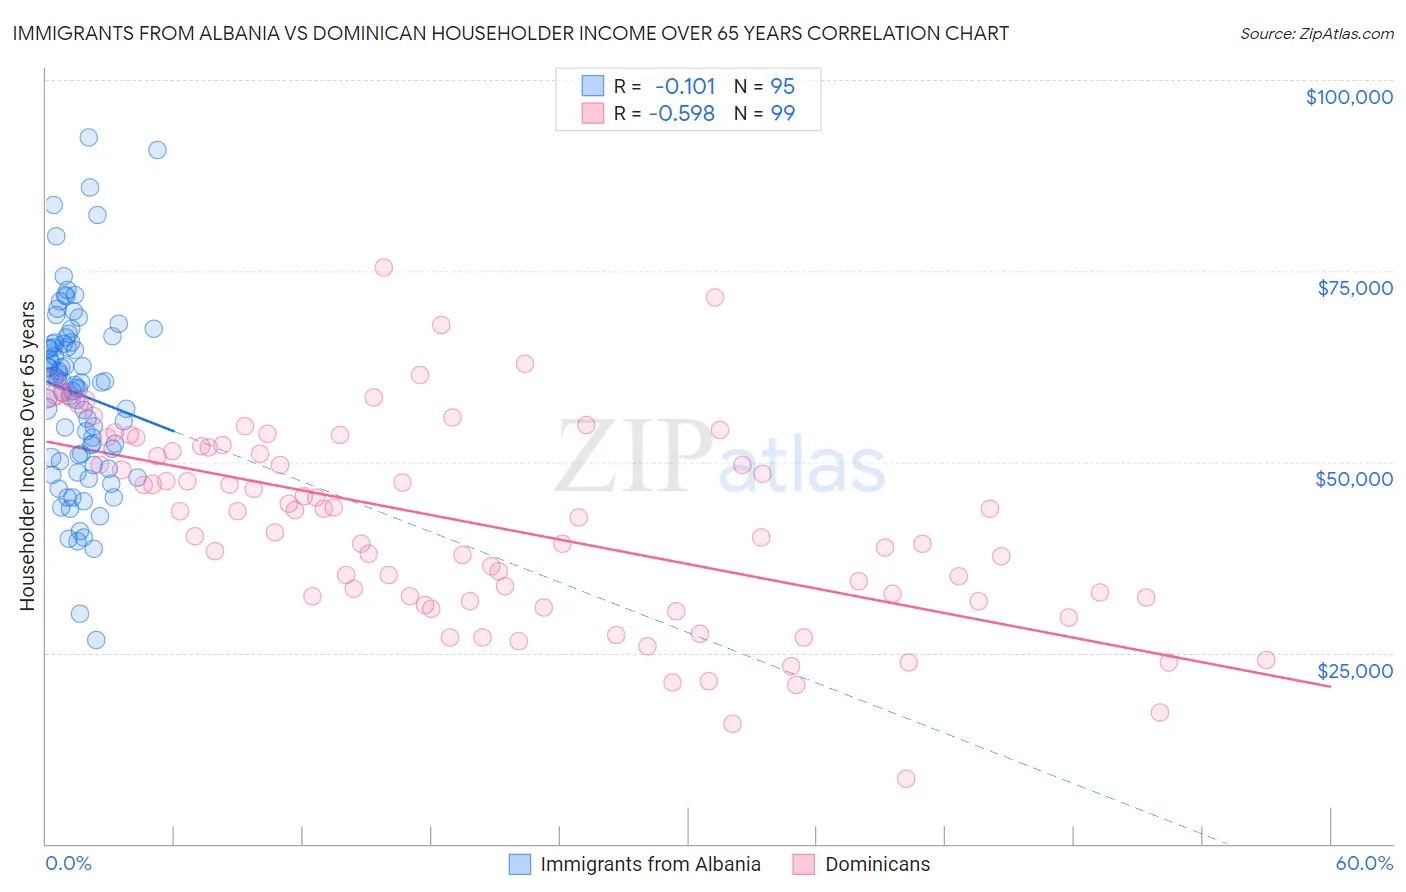
Immigrants from Albania vs Dominican Householder Income Over 65 years Correlation Chart
The statistical analysis conducted on geographies consisting of 119,282,726 people shows a poor negative correlation between the proportion of Immigrants from Albania and household income with householder over the age of 65 in the United States with a correlation coefficient (R) of -0.101 and weighted average of $57,828. Similarly, the statistical analysis conducted on geographies consisting of 353,452,286 people shows a substantial negative correlation between the proportion of Dominicans and household income with householder over the age of 65 in the United States with a correlation coefficient (R) of -0.598 and weighted average of $46,964, a difference of 23.1%.
Householder Income Over 65 years Correlation Summary
| Measurement | Immigrants from Albania | Dominican |
| Minimum | $26,735 | $8,529 |
| Maximum | $92,399 | $75,483 |
| Range | $65,664 | $66,954 |
| Mean | $58,952 | $41,882 |
| Median | $60,343 | $43,498 |
| Interquartile 25% (IQ1) | $50,536 | $32,229 |
| Interquartile 75% (IQ3) | $65,637 | $52,008 |
| Interquartile Range (IQR) | $15,102 | $19,779 |
| Standard Deviation (Sample) | $12,020 | $13,021 |
| Standard Deviation (Population) | $11,957 | $12,955 |
Similar Demographics by Householder Income Over 65 years
Demographics Similar to Immigrants from Albania by Householder Income Over 65 years
In terms of householder income over 65 years, the demographic groups most similar to Immigrants from Albania are Japanese ($57,919, a difference of 0.16%), French Canadian ($57,975, a difference of 0.25%), Immigrants from Colombia ($57,658, a difference of 0.29%), Venezuelan ($58,026, a difference of 0.34%), and Immigrants from Cambodia ($57,580, a difference of 0.43%).
| Demographics | Rating | Rank | Householder Income Over 65 years |
| Immigrants | El Salvador | 5.4 /100 | #221 | Tragic $58,226 |
| Delaware | 5.3 /100 | #222 | Tragic $58,214 |
| Tsimshian | 5.2 /100 | #223 | Tragic $58,202 |
| Bermudans | 5.1 /100 | #224 | Tragic $58,171 |
| Venezuelans | 4.4 /100 | #225 | Tragic $58,026 |
| French Canadians | 4.2 /100 | #226 | Tragic $57,975 |
| Japanese | 3.9 /100 | #227 | Tragic $57,919 |
| Immigrants | Albania | 3.6 /100 | #228 | Tragic $57,828 |
| Immigrants | Colombia | 3.0 /100 | #229 | Tragic $57,658 |
| Immigrants | Cambodia | 2.8 /100 | #230 | Tragic $57,580 |
| Immigrants | Nonimmigrants | 2.4 /100 | #231 | Tragic $57,426 |
| Immigrants | Venezuela | 2.3 /100 | #232 | Tragic $57,371 |
| Immigrants | Western Africa | 1.7 /100 | #233 | Tragic $57,119 |
| Immigrants | Burma/Myanmar | 1.7 /100 | #234 | Tragic $57,114 |
| Spanish Americans | 1.6 /100 | #235 | Tragic $57,021 |
Demographics Similar to Dominicans by Householder Income Over 65 years
In terms of householder income over 65 years, the demographic groups most similar to Dominicans are Immigrants from Cabo Verde ($46,654, a difference of 0.66%), Immigrants from Yemen ($47,527, a difference of 1.2%), Navajo ($47,722, a difference of 1.6%), Immigrants from Dominican Republic ($45,758, a difference of 2.6%), and Immigrants from Caribbean ($48,535, a difference of 3.3%).
| Demographics | Rating | Rank | Householder Income Over 65 years |
| Cape Verdeans | 0.0 /100 | #333 | Tragic $50,077 |
| Immigrants | Dominica | 0.0 /100 | #334 | Tragic $50,071 |
| Crow | 0.0 /100 | #335 | Tragic $49,234 |
| Cubans | 0.0 /100 | #336 | Tragic $49,152 |
| Tohono O'odham | 0.0 /100 | #337 | Tragic $49,121 |
| Immigrants | Caribbean | 0.0 /100 | #338 | Tragic $48,535 |
| Navajo | 0.0 /100 | #339 | Tragic $47,722 |
| Immigrants | Yemen | 0.0 /100 | #340 | Tragic $47,527 |
| Dominicans | 0.0 /100 | #341 | Tragic $46,964 |
| Immigrants | Cabo Verde | 0.0 /100 | #342 | Tragic $46,654 |
| Immigrants | Dominican Republic | 0.0 /100 | #343 | Tragic $45,758 |
| Houma | 0.0 /100 | #344 | Tragic $44,822 |
| Immigrants | Cuba | 0.0 /100 | #345 | Tragic $44,735 |
| Puerto Ricans | 0.0 /100 | #346 | Tragic $42,550 |
| Lumbee | 0.0 /100 | #347 | Tragic $40,550 |