Hawaiian vs Immigrants from Turkey Householder Income Over 65 years
COMPARE
Hawaiian
Immigrants from Turkey
Householder Income Over 65 years
Householder Income Over 65 years Comparison
Hawaiians
Immigrants from Turkey
$64,920
HOUSEHOLDER INCOME OVER 65 YEARS
98.4/ 100
METRIC RATING
79th/ 347
METRIC RANK
$66,672
HOUSEHOLDER INCOME OVER 65 YEARS
99.7/ 100
METRIC RATING
50th/ 347
METRIC RANK
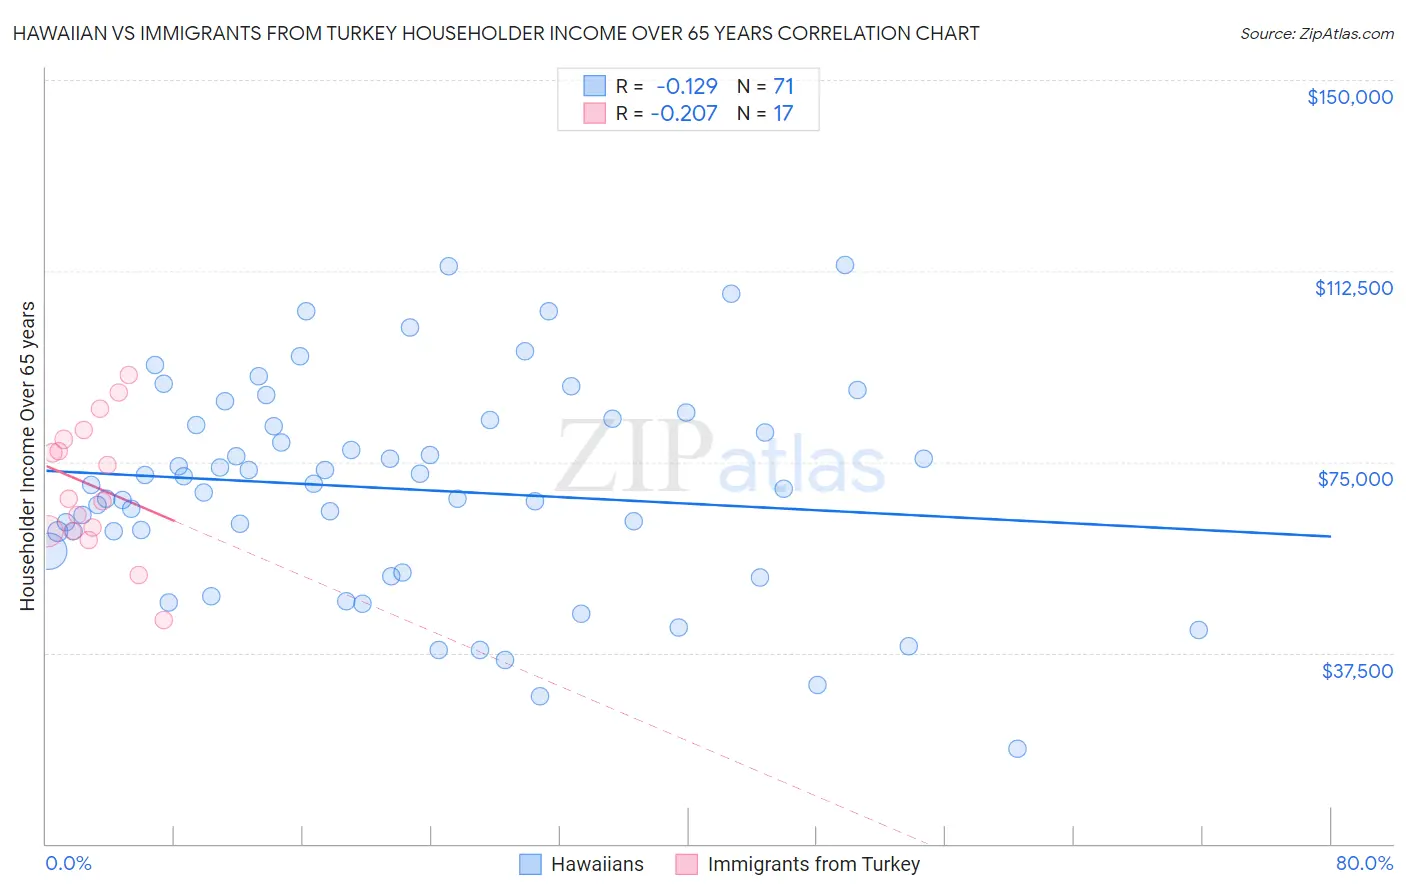
Hawaiian vs Immigrants from Turkey Householder Income Over 65 years Correlation Chart
The statistical analysis conducted on geographies consisting of 326,215,484 people shows a poor negative correlation between the proportion of Hawaiians and household income with householder over the age of 65 in the United States with a correlation coefficient (R) of -0.129 and weighted average of $64,920. Similarly, the statistical analysis conducted on geographies consisting of 222,687,892 people shows a weak negative correlation between the proportion of Immigrants from Turkey and household income with householder over the age of 65 in the United States with a correlation coefficient (R) of -0.207 and weighted average of $66,672, a difference of 2.7%.
Householder Income Over 65 years Correlation Summary
| Measurement | Hawaiian | Immigrants from Turkey |
| Minimum | $18,720 | $43,837 |
| Maximum | $113,750 | $92,034 |
| Range | $95,030 | $48,197 |
| Mean | $69,704 | $70,329 |
| Median | $70,484 | $67,840 |
| Interquartile 25% (IQ1) | $57,420 | $61,337 |
| Interquartile 75% (IQ3) | $83,133 | $80,283 |
| Interquartile Range (IQR) | $25,713 | $18,946 |
| Standard Deviation (Sample) | $20,668 | $13,059 |
| Standard Deviation (Population) | $20,522 | $12,670 |
Similar Demographics by Householder Income Over 65 years
Demographics Similar to Hawaiians by Householder Income Over 65 years
In terms of householder income over 65 years, the demographic groups most similar to Hawaiians are Immigrants from Western Europe ($64,933, a difference of 0.020%), Immigrants from Canada ($64,952, a difference of 0.050%), Immigrants from North America ($64,856, a difference of 0.10%), Ethiopian ($64,989, a difference of 0.11%), and Immigrants from Europe ($64,828, a difference of 0.14%).
| Demographics | Rating | Rank | Householder Income Over 65 years |
| Argentineans | 98.9 /100 | #72 | Exceptional $65,246 |
| Immigrants | Ethiopia | 98.9 /100 | #73 | Exceptional $65,238 |
| Lithuanians | 98.8 /100 | #74 | Exceptional $65,209 |
| Sierra Leoneans | 98.6 /100 | #75 | Exceptional $65,038 |
| Ethiopians | 98.5 /100 | #76 | Exceptional $64,989 |
| Immigrants | Canada | 98.5 /100 | #77 | Exceptional $64,952 |
| Immigrants | Western Europe | 98.5 /100 | #78 | Exceptional $64,933 |
| Hawaiians | 98.4 /100 | #79 | Exceptional $64,920 |
| Immigrants | North America | 98.3 /100 | #80 | Exceptional $64,856 |
| Immigrants | Europe | 98.3 /100 | #81 | Exceptional $64,828 |
| Immigrants | Fiji | 98.2 /100 | #82 | Exceptional $64,795 |
| Northern Europeans | 97.9 /100 | #83 | Exceptional $64,658 |
| Immigrants | Greece | 97.9 /100 | #84 | Exceptional $64,636 |
| Immigrants | Lebanon | 97.6 /100 | #85 | Exceptional $64,521 |
| Immigrants | Russia | 97.6 /100 | #86 | Exceptional $64,512 |
Demographics Similar to Immigrants from Turkey by Householder Income Over 65 years
In terms of householder income over 65 years, the demographic groups most similar to Immigrants from Turkey are Immigrants from Indonesia ($66,694, a difference of 0.030%), Israeli ($66,636, a difference of 0.050%), Immigrants from Scotland ($66,620, a difference of 0.080%), Immigrants from Pakistan ($66,617, a difference of 0.080%), and Immigrants from France ($66,826, a difference of 0.23%).
| Demographics | Rating | Rank | Householder Income Over 65 years |
| Latvians | 99.9 /100 | #43 | Exceptional $67,326 |
| Immigrants | South Africa | 99.9 /100 | #44 | Exceptional $67,234 |
| Immigrants | Afghanistan | 99.8 /100 | #45 | Exceptional $67,007 |
| Cambodians | 99.8 /100 | #46 | Exceptional $66,892 |
| Australians | 99.8 /100 | #47 | Exceptional $66,891 |
| Immigrants | France | 99.8 /100 | #48 | Exceptional $66,826 |
| Immigrants | Indonesia | 99.8 /100 | #49 | Exceptional $66,694 |
| Immigrants | Turkey | 99.7 /100 | #50 | Exceptional $66,672 |
| Israelis | 99.7 /100 | #51 | Exceptional $66,636 |
| Immigrants | Scotland | 99.7 /100 | #52 | Exceptional $66,620 |
| Immigrants | Pakistan | 99.7 /100 | #53 | Exceptional $66,617 |
| Immigrants | Netherlands | 99.7 /100 | #54 | Exceptional $66,463 |
| Immigrants | Czechoslovakia | 99.7 /100 | #55 | Exceptional $66,376 |
| Laotians | 99.6 /100 | #56 | Exceptional $66,306 |
| Bulgarians | 99.6 /100 | #57 | Exceptional $66,236 |