Hawaiian vs Costa Rican Householder Income Under 25 years
COMPARE
Hawaiian
Costa Rican
Householder Income Under 25 years
Householder Income Under 25 years Comparison
Hawaiians
Costa Ricans
$53,078
HOUSEHOLDER INCOME UNDER 25 YEARS
89.8/ 100
METRIC RATING
140th/ 347
METRIC RANK
$53,106
HOUSEHOLDER INCOME UNDER 25 YEARS
90.4/ 100
METRIC RATING
139th/ 347
METRIC RANK
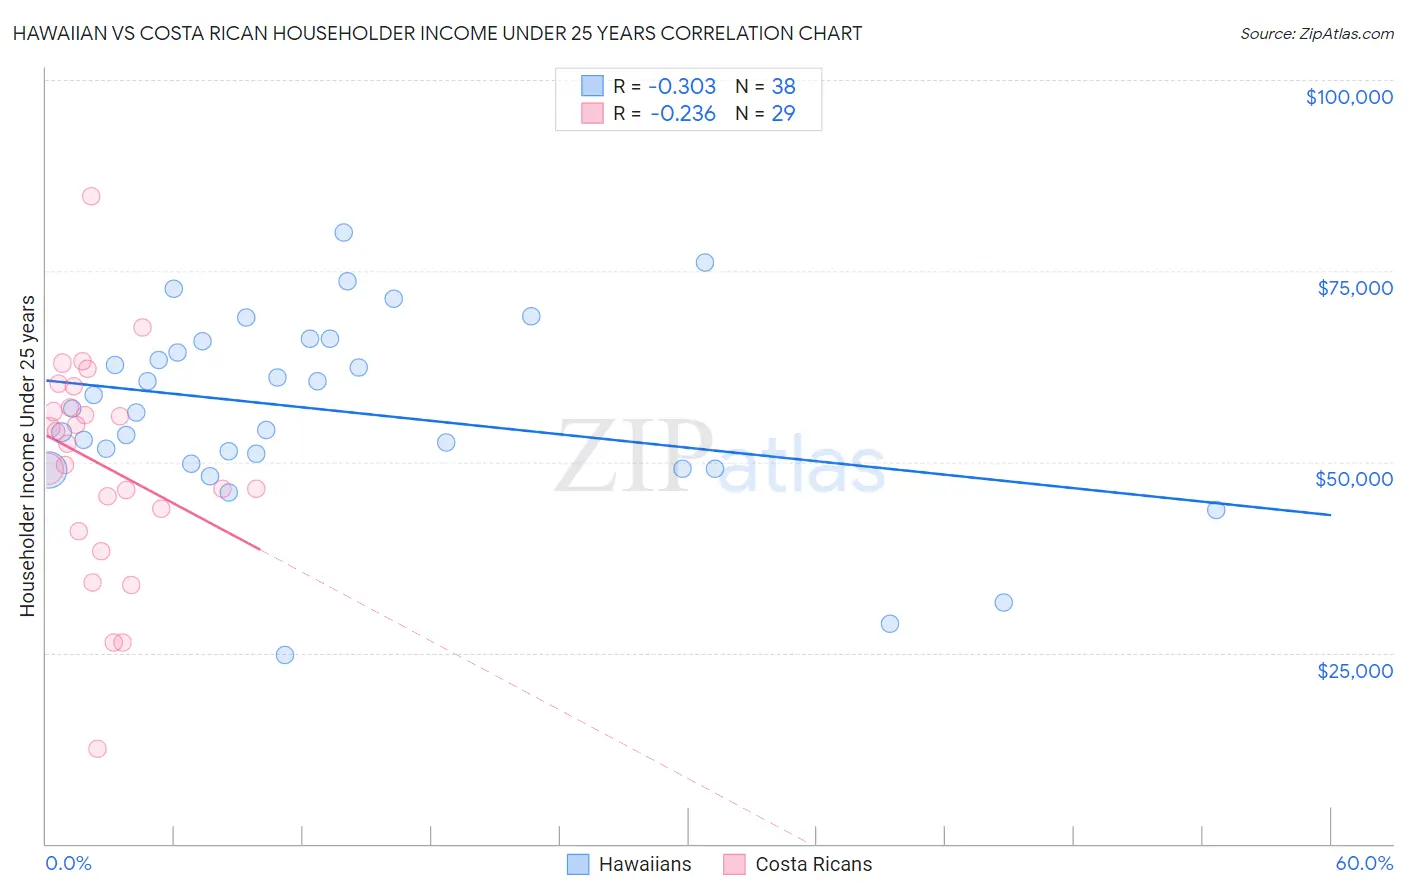
Hawaiian vs Costa Rican Householder Income Under 25 years Correlation Chart
The statistical analysis conducted on geographies consisting of 288,171,696 people shows a mild negative correlation between the proportion of Hawaiians and household income with householder under the age of 25 in the United States with a correlation coefficient (R) of -0.303 and weighted average of $53,078. Similarly, the statistical analysis conducted on geographies consisting of 223,147,061 people shows a weak negative correlation between the proportion of Costa Ricans and household income with householder under the age of 25 in the United States with a correlation coefficient (R) of -0.236 and weighted average of $53,106, a difference of 0.050%.
Householder Income Under 25 years Correlation Summary
| Measurement | Hawaiian | Costa Rican |
| Minimum | $24,709 | $12,500 |
| Maximum | $80,098 | $84,835 |
| Range | $55,389 | $72,335 |
| Mean | $56,783 | $49,718 |
| Median | $56,779 | $52,363 |
| Interquartile 25% (IQ1) | $49,786 | $42,331 |
| Interquartile 75% (IQ3) | $65,721 | $58,497 |
| Interquartile Range (IQR) | $15,935 | $16,166 |
| Standard Deviation (Sample) | $12,327 | $14,394 |
| Standard Deviation (Population) | $12,164 | $14,143 |
Demographics Similar to Hawaiians and Costa Ricans by Householder Income Under 25 years
In terms of householder income under 25 years, the demographic groups most similar to Hawaiians are Danish ($53,041, a difference of 0.070%), Norwegian ($53,127, a difference of 0.090%), Immigrants from Barbados ($53,163, a difference of 0.16%), Immigrants from Armenia ($52,986, a difference of 0.17%), and Swedish ($52,986, a difference of 0.17%). Similarly, the demographic groups most similar to Costa Ricans are Norwegian ($53,127, a difference of 0.040%), Immigrants from Barbados ($53,163, a difference of 0.11%), Danish ($53,041, a difference of 0.12%), Armenian ($53,179, a difference of 0.14%), and Immigrants from Northern Africa ($53,185, a difference of 0.15%).
| Demographics | Rating | Rank | Householder Income Under 25 years |
| New Zealanders | 93.7 /100 | #129 | Exceptional $53,294 |
| Nicaraguans | 93.4 /100 | #130 | Exceptional $53,275 |
| Immigrants | Nicaragua | 93.3 /100 | #131 | Exceptional $53,266 |
| Moroccans | 93.1 /100 | #132 | Exceptional $53,256 |
| Immigrants | Immigrants | 92.2 /100 | #133 | Exceptional $53,201 |
| Immigrants | Northern Africa | 91.9 /100 | #134 | Exceptional $53,185 |
| Chileans | 91.9 /100 | #135 | Exceptional $53,185 |
| Armenians | 91.8 /100 | #136 | Exceptional $53,179 |
| Immigrants | Barbados | 91.5 /100 | #137 | Exceptional $53,163 |
| Norwegians | 90.8 /100 | #138 | Exceptional $53,127 |
| Costa Ricans | 90.4 /100 | #139 | Exceptional $53,106 |
| Hawaiians | 89.8 /100 | #140 | Excellent $53,078 |
| Danes | 88.9 /100 | #141 | Excellent $53,041 |
| Immigrants | Armenia | 87.5 /100 | #142 | Excellent $52,986 |
| Swedes | 87.5 /100 | #143 | Excellent $52,986 |
| South American Indians | 87.3 /100 | #144 | Excellent $52,979 |
| Immigrants | Western Europe | 86.7 /100 | #145 | Excellent $52,957 |
| Immigrants | Hungary | 81.6 /100 | #146 | Excellent $52,798 |
| Latvians | 81.0 /100 | #147 | Excellent $52,783 |
| French Canadians | 76.5 /100 | #148 | Good $52,672 |
| Scandinavians | 75.7 /100 | #149 | Good $52,654 |