Greek vs Immigrants from Sudan Median Female Earnings
COMPARE
Greek
Immigrants from Sudan
Median Female Earnings
Median Female Earnings Comparison
Greeks
Immigrants from Sudan
$42,336
MEDIAN FEMALE EARNINGS
99.6/ 100
METRIC RATING
79th/ 347
METRIC RANK
$38,511
MEDIAN FEMALE EARNINGS
7.8/ 100
METRIC RATING
223rd/ 347
METRIC RANK
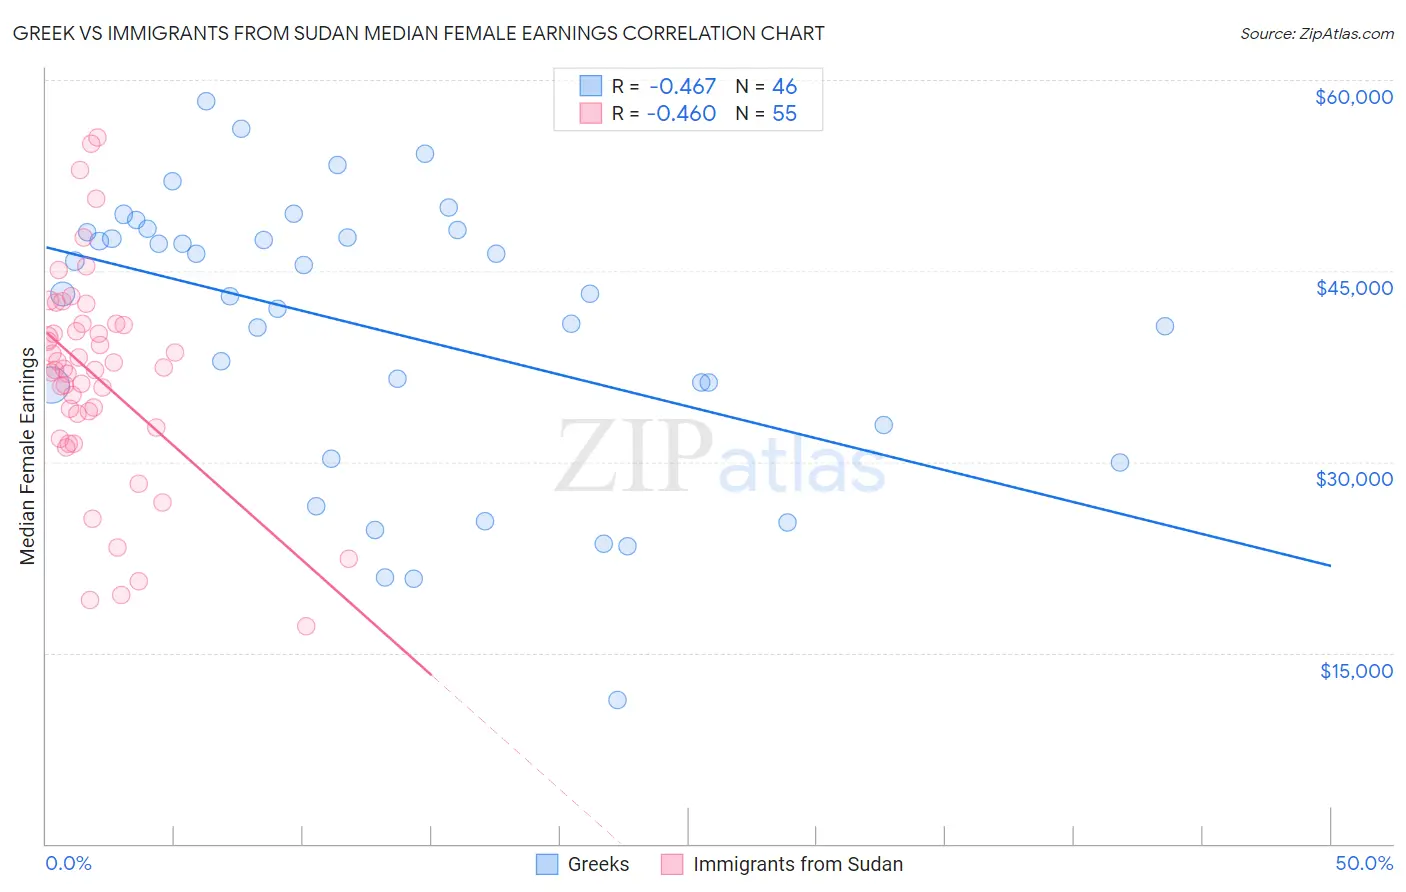
Greek vs Immigrants from Sudan Median Female Earnings Correlation Chart
The statistical analysis conducted on geographies consisting of 482,348,495 people shows a moderate negative correlation between the proportion of Greeks and median female earnings in the United States with a correlation coefficient (R) of -0.467 and weighted average of $42,336. Similarly, the statistical analysis conducted on geographies consisting of 118,958,094 people shows a moderate negative correlation between the proportion of Immigrants from Sudan and median female earnings in the United States with a correlation coefficient (R) of -0.460 and weighted average of $38,511, a difference of 9.9%.
Median Female Earnings Correlation Summary
| Measurement | Greek | Immigrants from Sudan |
| Minimum | $11,250 | $17,051 |
| Maximum | $58,379 | $55,449 |
| Range | $47,129 | $38,398 |
| Mean | $40,351 | $36,677 |
| Median | $43,165 | $37,284 |
| Interquartile 25% (IQ1) | $32,889 | $32,734 |
| Interquartile 75% (IQ3) | $48,068 | $40,805 |
| Interquartile Range (IQR) | $15,179 | $8,071 |
| Standard Deviation (Sample) | $10,999 | $8,385 |
| Standard Deviation (Population) | $10,879 | $8,308 |
Similar Demographics by Median Female Earnings
Demographics Similar to Greeks by Median Female Earnings
In terms of median female earnings, the demographic groups most similar to Greeks are Immigrants from Moldova ($42,304, a difference of 0.080%), Immigrants from Albania ($42,388, a difference of 0.12%), Immigrants from Kazakhstan ($42,386, a difference of 0.12%), Immigrants from Southern Europe ($42,275, a difference of 0.15%), and Immigrants from Morocco ($42,229, a difference of 0.25%).
| Demographics | Rating | Rank | Median Female Earnings |
| Albanians | 99.8 /100 | #72 | Exceptional $42,584 |
| Mongolians | 99.7 /100 | #73 | Exceptional $42,542 |
| Immigrants | South Africa | 99.7 /100 | #74 | Exceptional $42,508 |
| New Zealanders | 99.7 /100 | #75 | Exceptional $42,446 |
| Immigrants | Italy | 99.7 /100 | #76 | Exceptional $42,446 |
| Immigrants | Albania | 99.6 /100 | #77 | Exceptional $42,388 |
| Immigrants | Kazakhstan | 99.6 /100 | #78 | Exceptional $42,386 |
| Greeks | 99.6 /100 | #79 | Exceptional $42,336 |
| Immigrants | Moldova | 99.6 /100 | #80 | Exceptional $42,304 |
| Immigrants | Southern Europe | 99.5 /100 | #81 | Exceptional $42,275 |
| Immigrants | Morocco | 99.5 /100 | #82 | Exceptional $42,229 |
| Immigrants | Sierra Leone | 99.5 /100 | #83 | Exceptional $42,214 |
| Armenians | 99.5 /100 | #84 | Exceptional $42,212 |
| Laotians | 99.4 /100 | #85 | Exceptional $42,133 |
| Immigrants | St. Vincent and the Grenadines | 99.3 /100 | #86 | Exceptional $42,108 |
Demographics Similar to Immigrants from Sudan by Median Female Earnings
In terms of median female earnings, the demographic groups most similar to Immigrants from Sudan are Japanese ($38,528, a difference of 0.040%), Native Hawaiian ($38,461, a difference of 0.13%), French ($38,457, a difference of 0.14%), Yugoslavian ($38,573, a difference of 0.16%), and Immigrants from the Azores ($38,573, a difference of 0.16%).
| Demographics | Rating | Rank | Median Female Earnings |
| Immigrants | Ecuador | 10.1 /100 | #216 | Poor $38,644 |
| Immigrants | Jamaica | 9.7 /100 | #217 | Tragic $38,625 |
| Cape Verdeans | 9.5 /100 | #218 | Tragic $38,614 |
| Nepalese | 9.3 /100 | #219 | Tragic $38,603 |
| Yugoslavians | 8.8 /100 | #220 | Tragic $38,573 |
| Immigrants | Azores | 8.8 /100 | #221 | Tragic $38,573 |
| Japanese | 8.1 /100 | #222 | Tragic $38,528 |
| Immigrants | Sudan | 7.8 /100 | #223 | Tragic $38,511 |
| Native Hawaiians | 7.1 /100 | #224 | Tragic $38,461 |
| French | 7.0 /100 | #225 | Tragic $38,457 |
| French Canadians | 6.8 /100 | #226 | Tragic $38,436 |
| Scottish | 6.3 /100 | #227 | Tragic $38,397 |
| Sub-Saharan Africans | 6.2 /100 | #228 | Tragic $38,391 |
| Belgians | 6.1 /100 | #229 | Tragic $38,382 |
| Basques | 5.7 /100 | #230 | Tragic $38,352 |