French Canadian vs Immigrants from Israel Median Male Earnings
COMPARE
French Canadian
Immigrants from Israel
Median Male Earnings
Median Male Earnings Comparison
French Canadians
Immigrants from Israel
$54,722
MEDIAN MALE EARNINGS
55.6/ 100
METRIC RATING
169th/ 347
METRIC RANK
$68,716
MEDIAN MALE EARNINGS
100.0/ 100
METRIC RATING
10th/ 347
METRIC RANK
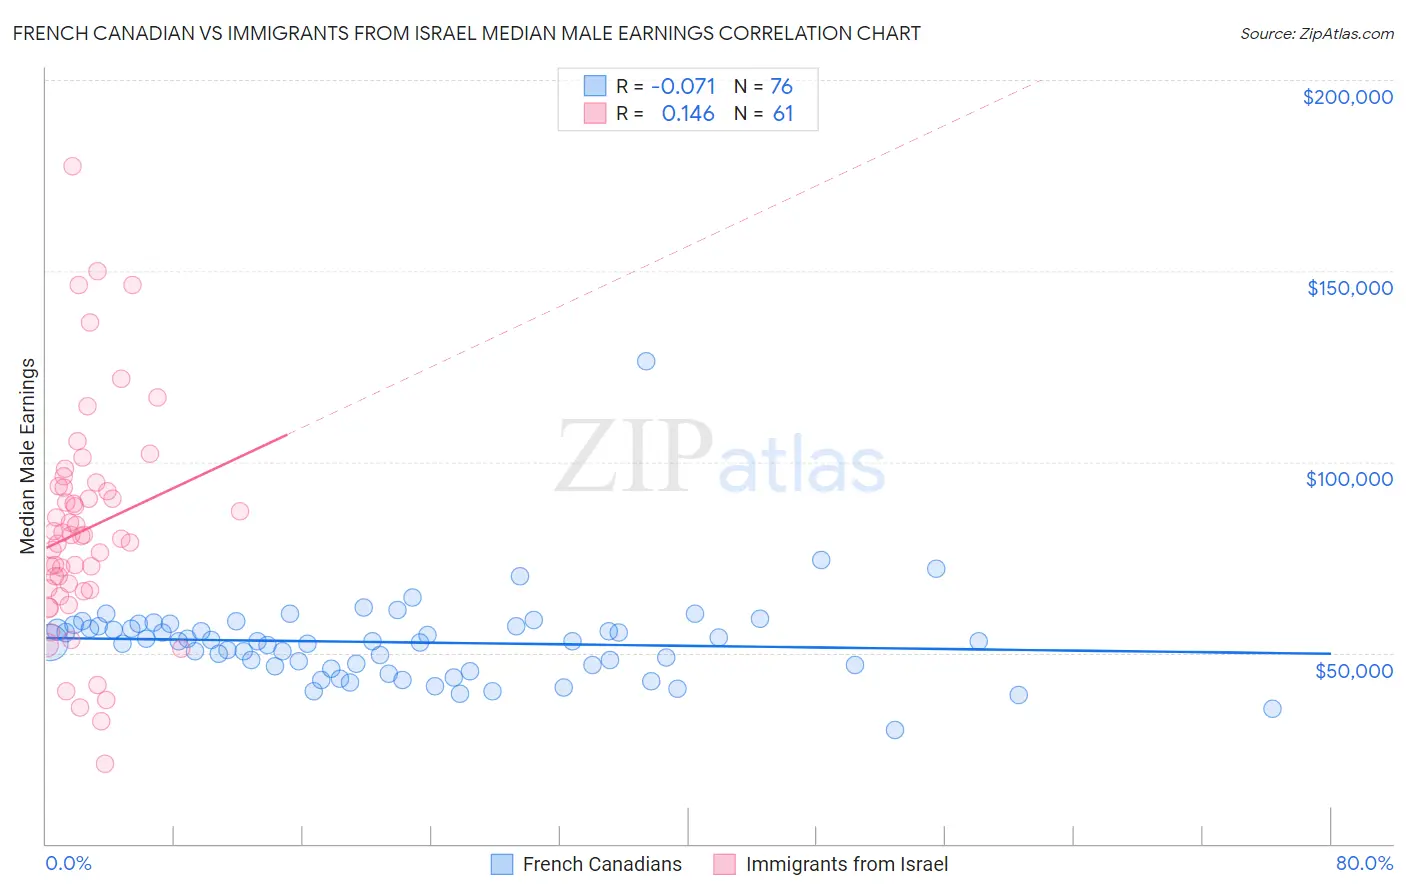
French Canadian vs Immigrants from Israel Median Male Earnings Correlation Chart
The statistical analysis conducted on geographies consisting of 502,178,853 people shows a slight negative correlation between the proportion of French Canadians and median male earnings in the United States with a correlation coefficient (R) of -0.071 and weighted average of $54,722. Similarly, the statistical analysis conducted on geographies consisting of 209,997,525 people shows a poor positive correlation between the proportion of Immigrants from Israel and median male earnings in the United States with a correlation coefficient (R) of 0.146 and weighted average of $68,716, a difference of 25.6%.
Median Male Earnings Correlation Summary
| Measurement | French Canadian | Immigrants from Israel |
| Minimum | $29,821 | $21,056 |
| Maximum | $126,333 | $177,500 |
| Range | $96,512 | $156,444 |
| Mean | $52,728 | $82,160 |
| Median | $52,909 | $80,676 |
| Interquartile 25% (IQ1) | $46,602 | $66,232 |
| Interquartile 75% (IQ3) | $56,878 | $93,582 |
| Interquartile Range (IQR) | $10,277 | $27,350 |
| Standard Deviation (Sample) | $11,742 | $29,382 |
| Standard Deviation (Population) | $11,665 | $29,141 |
Similar Demographics by Median Male Earnings
Demographics Similar to French Canadians by Median Male Earnings
In terms of median male earnings, the demographic groups most similar to French Canadians are Finnish ($54,721, a difference of 0.0%), Immigrants from Peru ($54,695, a difference of 0.050%), Welsh ($54,647, a difference of 0.14%), Immigrants from Vietnam ($54,913, a difference of 0.35%), and South American Indian ($54,508, a difference of 0.39%).
| Demographics | Rating | Rank | Median Male Earnings |
| French | 69.9 /100 | #162 | Good $55,350 |
| Ugandans | 68.6 /100 | #163 | Good $55,290 |
| Immigrants | South Eastern Asia | 67.6 /100 | #164 | Good $55,241 |
| Immigrants | Portugal | 66.3 /100 | #165 | Good $55,182 |
| Germans | 61.6 /100 | #166 | Good $54,974 |
| Immigrants | Fiji | 61.2 /100 | #167 | Good $54,958 |
| Immigrants | Vietnam | 60.2 /100 | #168 | Good $54,913 |
| French Canadians | 55.6 /100 | #169 | Average $54,722 |
| Finns | 55.6 /100 | #170 | Average $54,721 |
| Immigrants | Peru | 54.9 /100 | #171 | Average $54,695 |
| Welsh | 53.8 /100 | #172 | Average $54,647 |
| South American Indians | 50.4 /100 | #173 | Average $54,508 |
| South Americans | 50.0 /100 | #174 | Average $54,492 |
| Dutch | 48.0 /100 | #175 | Average $54,410 |
| Spaniards | 47.8 /100 | #176 | Average $54,401 |
Demographics Similar to Immigrants from Israel by Median Male Earnings
In terms of median male earnings, the demographic groups most similar to Immigrants from Israel are Immigrants from South Central Asia ($68,960, a difference of 0.35%), Immigrants from Iran ($69,284, a difference of 0.83%), Immigrants from Ireland ($67,698, a difference of 1.5%), Immigrants from Australia ($67,634, a difference of 1.6%), and Immigrants from China ($67,353, a difference of 2.0%).
| Demographics | Rating | Rank | Median Male Earnings |
| Immigrants | Taiwan | 100.0 /100 | #3 | Exceptional $74,031 |
| Thais | 100.0 /100 | #4 | Exceptional $72,135 |
| Immigrants | Singapore | 100.0 /100 | #5 | Exceptional $71,348 |
| Iranians | 100.0 /100 | #6 | Exceptional $70,648 |
| Immigrants | Hong Kong | 100.0 /100 | #7 | Exceptional $70,146 |
| Immigrants | Iran | 100.0 /100 | #8 | Exceptional $69,284 |
| Immigrants | South Central Asia | 100.0 /100 | #9 | Exceptional $68,960 |
| Immigrants | Israel | 100.0 /100 | #10 | Exceptional $68,716 |
| Immigrants | Ireland | 100.0 /100 | #11 | Exceptional $67,698 |
| Immigrants | Australia | 100.0 /100 | #12 | Exceptional $67,634 |
| Immigrants | China | 100.0 /100 | #13 | Exceptional $67,353 |
| Okinawans | 100.0 /100 | #14 | Exceptional $67,232 |
| Immigrants | Eastern Asia | 100.0 /100 | #15 | Exceptional $66,903 |
| Eastern Europeans | 100.0 /100 | #16 | Exceptional $66,472 |
| Immigrants | Belgium | 100.0 /100 | #17 | Exceptional $66,125 |