Finnish vs Immigrants from Bolivia Per Capita Income
COMPARE
Finnish
Immigrants from Bolivia
Per Capita Income
Per Capita Income Comparison
Finns
Immigrants from Bolivia
$43,461
PER CAPITA INCOME
44.4/ 100
METRIC RATING
179th/ 347
METRIC RANK
$48,970
PER CAPITA INCOME
99.7/ 100
METRIC RATING
75th/ 347
METRIC RANK
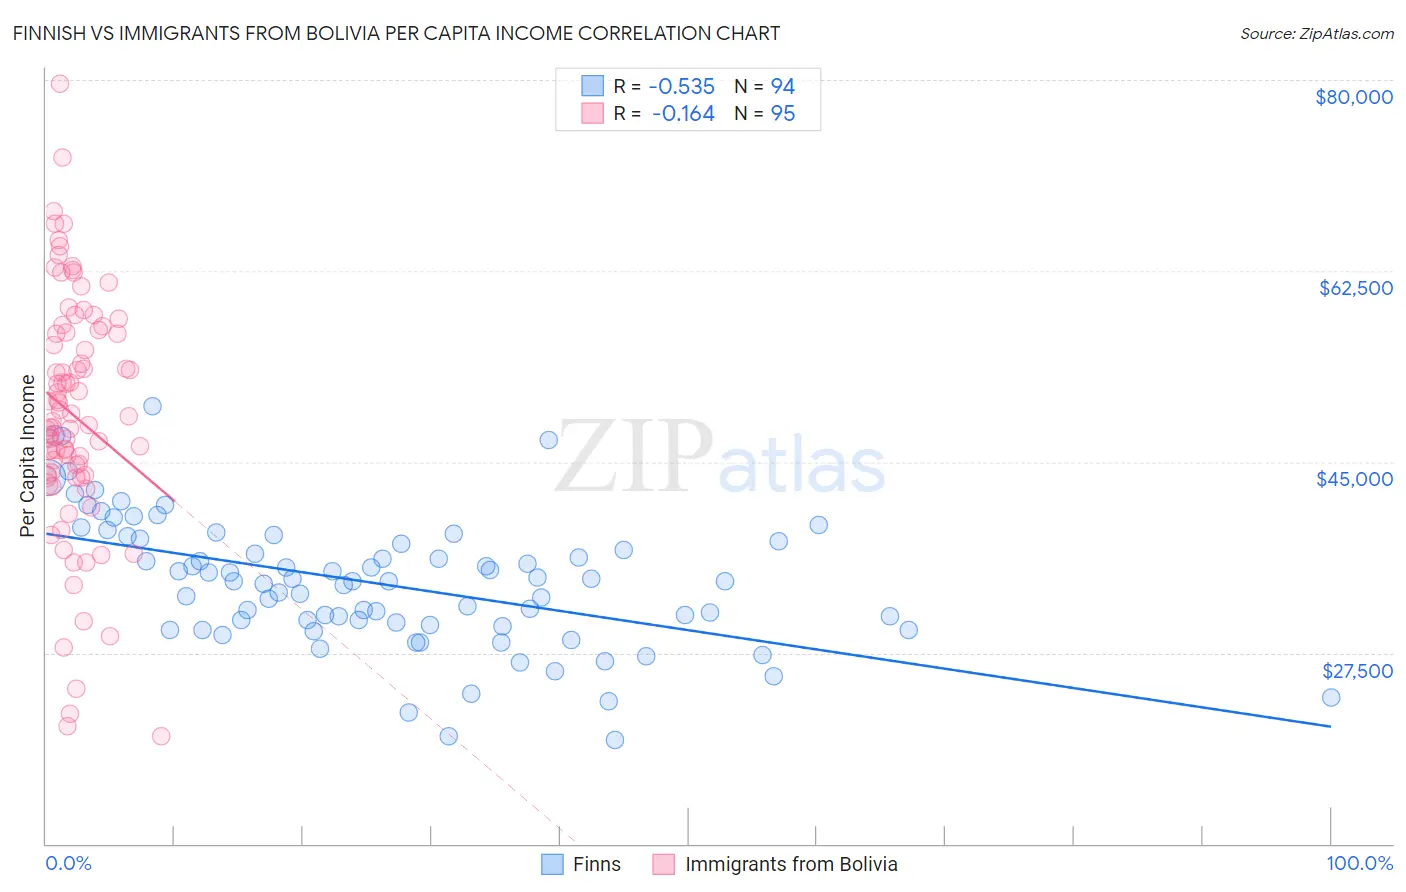
Finnish vs Immigrants from Bolivia Per Capita Income Correlation Chart
The statistical analysis conducted on geographies consisting of 404,694,586 people shows a substantial negative correlation between the proportion of Finns and per capita income in the United States with a correlation coefficient (R) of -0.535 and weighted average of $43,461. Similarly, the statistical analysis conducted on geographies consisting of 158,726,155 people shows a poor negative correlation between the proportion of Immigrants from Bolivia and per capita income in the United States with a correlation coefficient (R) of -0.164 and weighted average of $48,970, a difference of 12.7%.
Per Capita Income Correlation Summary
| Measurement | Finnish | Immigrants from Bolivia |
| Minimum | $19,546 | $19,857 |
| Maximum | $50,135 | $79,655 |
| Range | $30,589 | $59,798 |
| Mean | $33,846 | $49,279 |
| Median | $34,020 | $48,688 |
| Interquartile 25% (IQ1) | $30,059 | $43,768 |
| Interquartile 75% (IQ3) | $37,749 | $56,811 |
| Interquartile Range (IQR) | $7,690 | $13,042 |
| Standard Deviation (Sample) | $5,978 | $11,114 |
| Standard Deviation (Population) | $5,946 | $11,056 |
Similar Demographics by Per Capita Income
Demographics Similar to Finns by Per Capita Income
In terms of per capita income, the demographic groups most similar to Finns are Immigrants from Costa Rica ($43,464, a difference of 0.010%), Tlingit-Haida ($43,516, a difference of 0.13%), Sierra Leonean ($43,405, a difference of 0.13%), Immigrants from South Eastern Asia ($43,539, a difference of 0.18%), and Celtic ($43,621, a difference of 0.37%).
| Demographics | Rating | Rank | Per Capita Income |
| Czechoslovakians | 54.1 /100 | #172 | Average $43,806 |
| French | 50.7 /100 | #173 | Average $43,685 |
| Colombians | 50.0 /100 | #174 | Average $43,661 |
| Celtics | 48.9 /100 | #175 | Average $43,621 |
| Immigrants | South Eastern Asia | 46.6 /100 | #176 | Average $43,539 |
| Tlingit-Haida | 45.9 /100 | #177 | Average $43,516 |
| Immigrants | Costa Rica | 44.5 /100 | #178 | Average $43,464 |
| Finns | 44.4 /100 | #179 | Average $43,461 |
| Sierra Leoneans | 42.9 /100 | #180 | Average $43,405 |
| Welsh | 38.2 /100 | #181 | Fair $43,233 |
| Immigrants | Vietnam | 38.1 /100 | #182 | Fair $43,229 |
| Germans | 33.9 /100 | #183 | Fair $43,067 |
| Spaniards | 32.9 /100 | #184 | Fair $43,028 |
| Immigrants | Immigrants | 32.5 /100 | #185 | Fair $43,010 |
| French Canadians | 32.3 /100 | #186 | Fair $43,003 |
Demographics Similar to Immigrants from Bolivia by Per Capita Income
In terms of per capita income, the demographic groups most similar to Immigrants from Bolivia are Immigrants from England ($48,844, a difference of 0.26%), Mongolian ($49,173, a difference of 0.41%), Immigrants from Kazakhstan ($48,747, a difference of 0.46%), Immigrants from Italy ($48,654, a difference of 0.65%), and Immigrants from Hungary ($49,303, a difference of 0.68%).
| Demographics | Rating | Rank | Per Capita Income |
| Lithuanians | 99.8 /100 | #68 | Exceptional $49,448 |
| Immigrants | Canada | 99.8 /100 | #69 | Exceptional $49,412 |
| Immigrants | Eastern Europe | 99.8 /100 | #70 | Exceptional $49,316 |
| Greeks | 99.8 /100 | #71 | Exceptional $49,309 |
| Immigrants | Hungary | 99.8 /100 | #72 | Exceptional $49,303 |
| Immigrants | North America | 99.8 /100 | #73 | Exceptional $49,302 |
| Mongolians | 99.8 /100 | #74 | Exceptional $49,173 |
| Immigrants | Bolivia | 99.7 /100 | #75 | Exceptional $48,970 |
| Immigrants | England | 99.7 /100 | #76 | Exceptional $48,844 |
| Immigrants | Kazakhstan | 99.7 /100 | #77 | Exceptional $48,747 |
| Immigrants | Italy | 99.6 /100 | #78 | Exceptional $48,654 |
| Romanians | 99.5 /100 | #79 | Exceptional $48,445 |
| Egyptians | 99.5 /100 | #80 | Exceptional $48,358 |
| Armenians | 99.4 /100 | #81 | Exceptional $48,287 |
| Immigrants | Indonesia | 99.4 /100 | #82 | Exceptional $48,195 |