European vs Yakama Median Household Income
COMPARE
European
Yakama
Median Household Income
Median Household Income Comparison
Europeans
Yakama
$88,751
MEDIAN HOUSEHOLD INCOME
91.2/ 100
METRIC RATING
132nd/ 347
METRIC RANK
$72,225
MEDIAN HOUSEHOLD INCOME
0.0/ 100
METRIC RATING
308th/ 347
METRIC RANK
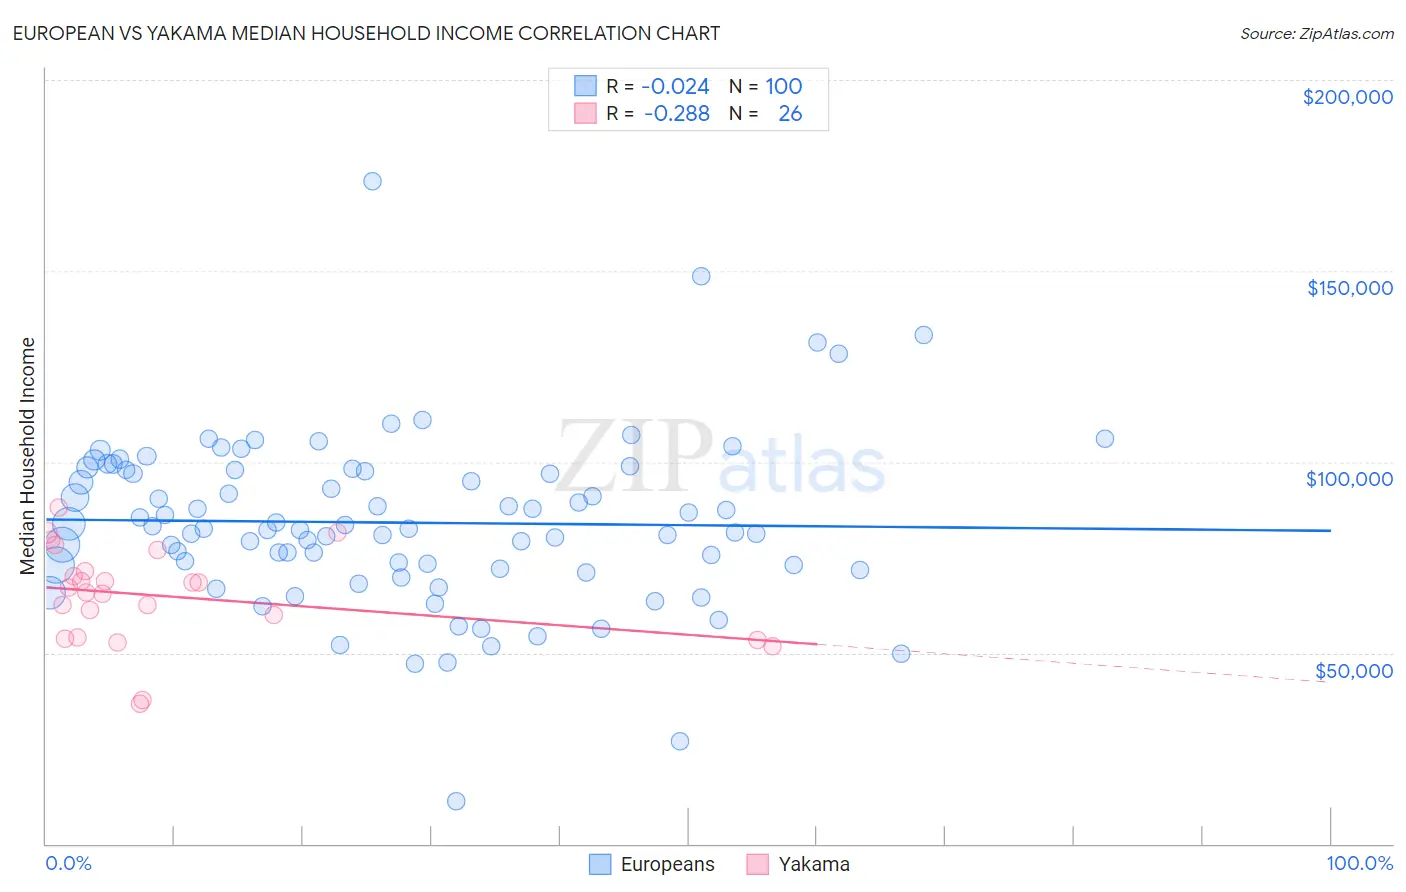
European vs Yakama Median Household Income Correlation Chart
The statistical analysis conducted on geographies consisting of 560,871,034 people shows no correlation between the proportion of Europeans and median household income in the United States with a correlation coefficient (R) of -0.024 and weighted average of $88,751. Similarly, the statistical analysis conducted on geographies consisting of 19,909,650 people shows a weak negative correlation between the proportion of Yakama and median household income in the United States with a correlation coefficient (R) of -0.288 and weighted average of $72,225, a difference of 22.9%.
Median Household Income Correlation Summary
| Measurement | European | Yakama |
| Minimum | $11,019 | $36,563 |
| Maximum | $173,396 | $88,202 |
| Range | $162,377 | $51,639 |
| Mean | $84,093 | $64,818 |
| Median | $82,550 | $66,477 |
| Interquartile 25% (IQ1) | $72,512 | $54,107 |
| Interquartile 75% (IQ3) | $97,852 | $71,429 |
| Interquartile Range (IQR) | $25,341 | $17,322 |
| Standard Deviation (Sample) | $22,686 | $12,734 |
| Standard Deviation (Population) | $22,572 | $12,487 |
Similar Demographics by Median Household Income
Demographics Similar to Europeans by Median Household Income
In terms of median household income, the demographic groups most similar to Europeans are Immigrants from Syria ($88,792, a difference of 0.050%), Immigrants from Ethiopia ($88,687, a difference of 0.070%), British ($88,914, a difference of 0.18%), Brazilian ($88,934, a difference of 0.21%), and Portuguese ($88,976, a difference of 0.25%).
| Demographics | Rating | Rank | Median Household Income |
| Immigrants | Kuwait | 93.5 /100 | #125 | Exceptional $89,263 |
| Immigrants | Oceania | 92.9 /100 | #126 | Exceptional $89,100 |
| Immigrants | Peru | 92.5 /100 | #127 | Exceptional $89,010 |
| Portuguese | 92.3 /100 | #128 | Exceptional $88,976 |
| Brazilians | 92.1 /100 | #129 | Exceptional $88,934 |
| British | 92.0 /100 | #130 | Exceptional $88,914 |
| Immigrants | Syria | 91.4 /100 | #131 | Exceptional $88,792 |
| Europeans | 91.2 /100 | #132 | Exceptional $88,751 |
| Immigrants | Ethiopia | 90.9 /100 | #133 | Exceptional $88,687 |
| Swedes | 90.0 /100 | #134 | Exceptional $88,524 |
| Immigrants | Sierra Leone | 89.9 /100 | #135 | Excellent $88,498 |
| Poles | 89.7 /100 | #136 | Excellent $88,472 |
| Sierra Leoneans | 89.6 /100 | #137 | Excellent $88,463 |
| Arabs | 89.2 /100 | #138 | Excellent $88,398 |
| Immigrants | Chile | 89.2 /100 | #139 | Excellent $88,388 |
Demographics Similar to Yakama by Median Household Income
In terms of median household income, the demographic groups most similar to Yakama are Ute ($72,402, a difference of 0.25%), Potawatomi ($72,576, a difference of 0.49%), Honduran ($72,588, a difference of 0.50%), Immigrants from Caribbean ($71,860, a difference of 0.51%), and Immigrants from Haiti ($72,599, a difference of 0.52%).
| Demographics | Rating | Rank | Median Household Income |
| Cherokee | 0.0 /100 | #301 | Tragic $72,682 |
| Shoshone | 0.0 /100 | #302 | Tragic $72,660 |
| Africans | 0.0 /100 | #303 | Tragic $72,650 |
| Immigrants | Haiti | 0.0 /100 | #304 | Tragic $72,599 |
| Hondurans | 0.0 /100 | #305 | Tragic $72,588 |
| Potawatomi | 0.0 /100 | #306 | Tragic $72,576 |
| Ute | 0.0 /100 | #307 | Tragic $72,402 |
| Yakama | 0.0 /100 | #308 | Tragic $72,225 |
| Immigrants | Caribbean | 0.0 /100 | #309 | Tragic $71,860 |
| U.S. Virgin Islanders | 0.0 /100 | #310 | Tragic $71,853 |
| Immigrants | Zaire | 0.0 /100 | #311 | Tragic $71,801 |
| Immigrants | Honduras | 0.0 /100 | #312 | Tragic $71,452 |
| Immigrants | Bahamas | 0.0 /100 | #313 | Tragic $71,349 |
| Dominicans | 0.0 /100 | #314 | Tragic $71,302 |
| Ottawa | 0.0 /100 | #315 | Tragic $70,984 |