Estonian vs Immigrants from Spain Median Female Earnings
COMPARE
Estonian
Immigrants from Spain
Median Female Earnings
Median Female Earnings Comparison
Estonians
Immigrants from Spain
$43,106
MEDIAN FEMALE EARNINGS
99.9/ 100
METRIC RATING
59th/ 347
METRIC RANK
$42,815
MEDIAN FEMALE EARNINGS
99.8/ 100
METRIC RATING
69th/ 347
METRIC RANK
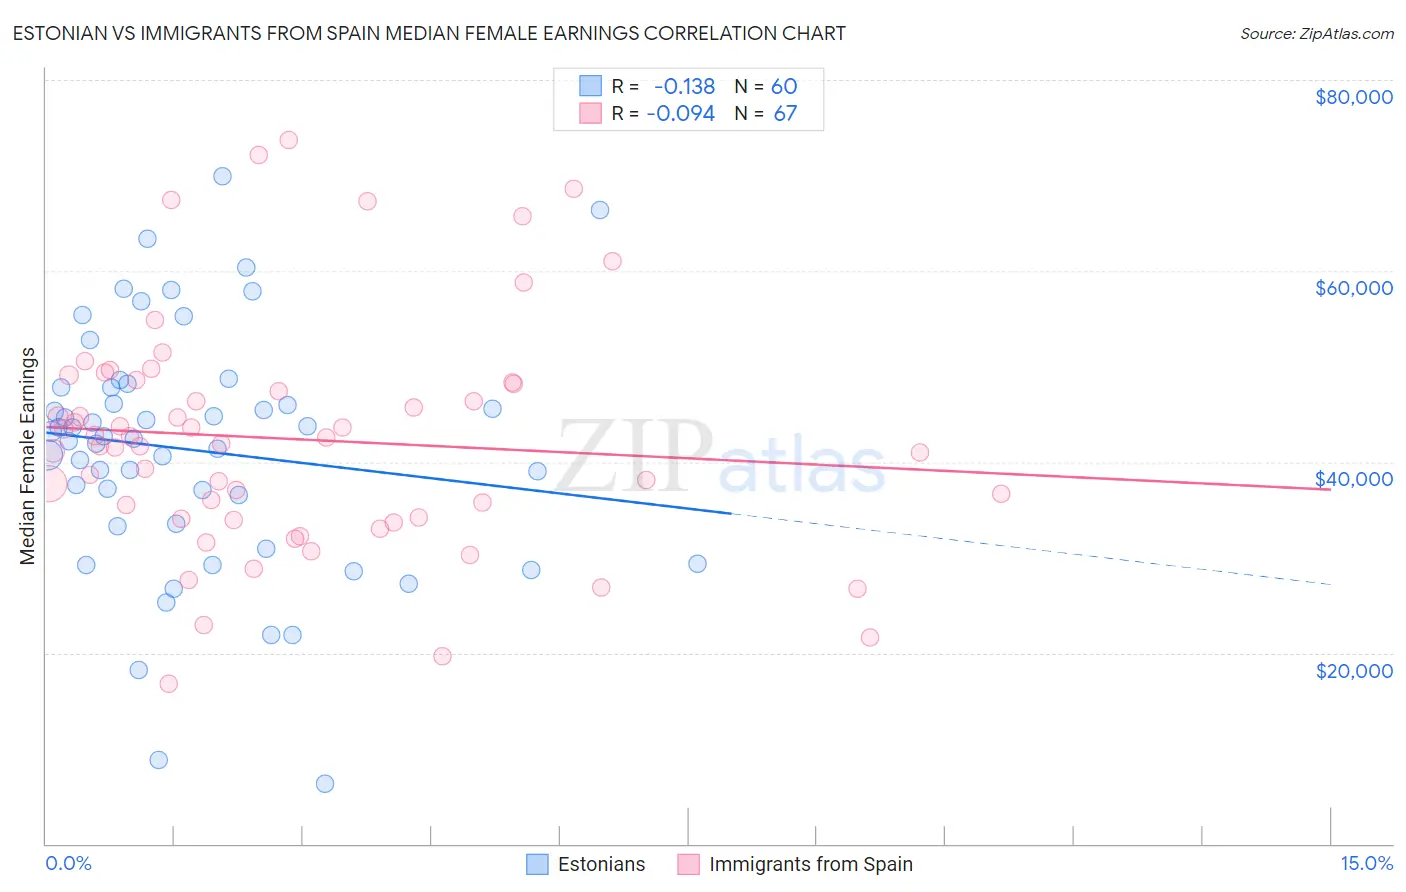
Estonian vs Immigrants from Spain Median Female Earnings Correlation Chart
The statistical analysis conducted on geographies consisting of 123,507,211 people shows a poor negative correlation between the proportion of Estonians and median female earnings in the United States with a correlation coefficient (R) of -0.138 and weighted average of $43,106. Similarly, the statistical analysis conducted on geographies consisting of 239,646,958 people shows a slight negative correlation between the proportion of Immigrants from Spain and median female earnings in the United States with a correlation coefficient (R) of -0.094 and weighted average of $42,815, a difference of 0.68%.
Median Female Earnings Correlation Summary
| Measurement | Estonian | Immigrants from Spain |
| Minimum | $6,250 | $16,765 |
| Maximum | $69,908 | $73,707 |
| Range | $63,658 | $56,942 |
| Mean | $41,197 | $42,367 |
| Median | $42,543 | $41,842 |
| Interquartile 25% (IQ1) | $33,356 | $34,065 |
| Interquartile 75% (IQ3) | $47,750 | $48,345 |
| Interquartile Range (IQR) | $14,393 | $14,280 |
| Standard Deviation (Sample) | $12,774 | $12,186 |
| Standard Deviation (Population) | $12,667 | $12,095 |
Demographics Similar to Estonians and Immigrants from Spain by Median Female Earnings
In terms of median female earnings, the demographic groups most similar to Estonians are Immigrants from Latvia ($43,099, a difference of 0.020%), Immigrants from Bulgaria ($43,085, a difference of 0.050%), Afghan ($43,077, a difference of 0.070%), Immigrants from Ukraine ($43,069, a difference of 0.090%), and Immigrants from Pakistan ($43,052, a difference of 0.12%). Similarly, the demographic groups most similar to Immigrants from Spain are Immigrants from Austria ($42,824, a difference of 0.020%), Immigrants from Norway ($42,837, a difference of 0.050%), Immigrants from Egypt ($42,837, a difference of 0.050%), Sierra Leonean ($42,868, a difference of 0.12%), and Immigrants from Ethiopia ($42,744, a difference of 0.17%).
| Demographics | Rating | Rank | Median Female Earnings |
| Australians | 99.9 /100 | #54 | Exceptional $43,308 |
| Egyptians | 99.9 /100 | #55 | Exceptional $43,305 |
| Immigrants | Croatia | 99.9 /100 | #56 | Exceptional $43,258 |
| Ethiopians | 99.9 /100 | #57 | Exceptional $43,243 |
| Paraguayans | 99.9 /100 | #58 | Exceptional $43,173 |
| Estonians | 99.9 /100 | #59 | Exceptional $43,106 |
| Immigrants | Latvia | 99.9 /100 | #60 | Exceptional $43,099 |
| Immigrants | Bulgaria | 99.9 /100 | #61 | Exceptional $43,085 |
| Afghans | 99.9 /100 | #62 | Exceptional $43,077 |
| Immigrants | Ukraine | 99.9 /100 | #63 | Exceptional $43,069 |
| Immigrants | Pakistan | 99.9 /100 | #64 | Exceptional $43,052 |
| Sierra Leoneans | 99.9 /100 | #65 | Exceptional $42,868 |
| Immigrants | Norway | 99.9 /100 | #66 | Exceptional $42,837 |
| Immigrants | Egypt | 99.9 /100 | #67 | Exceptional $42,837 |
| Immigrants | Austria | 99.8 /100 | #68 | Exceptional $42,824 |
| Immigrants | Spain | 99.8 /100 | #69 | Exceptional $42,815 |
| Immigrants | Ethiopia | 99.8 /100 | #70 | Exceptional $42,744 |
| Immigrants | Romania | 99.8 /100 | #71 | Exceptional $42,718 |
| Albanians | 99.8 /100 | #72 | Exceptional $42,584 |
| Mongolians | 99.7 /100 | #73 | Exceptional $42,542 |
| Immigrants | South Africa | 99.7 /100 | #74 | Exceptional $42,508 |