Comanche vs Immigrants from Romania Householder Income Ages 45 - 64 years
COMPARE
Comanche
Immigrants from Romania
Householder Income Ages 45 - 64 years
Householder Income Ages 45 - 64 years Comparison
Comanche
Immigrants from Romania
$85,787
HOUSEHOLDER INCOME AGES 45 - 64 YEARS
0.1/ 100
METRIC RATING
293rd/ 347
METRIC RANK
$110,633
HOUSEHOLDER INCOME AGES 45 - 64 YEARS
99.4/ 100
METRIC RATING
68th/ 347
METRIC RANK
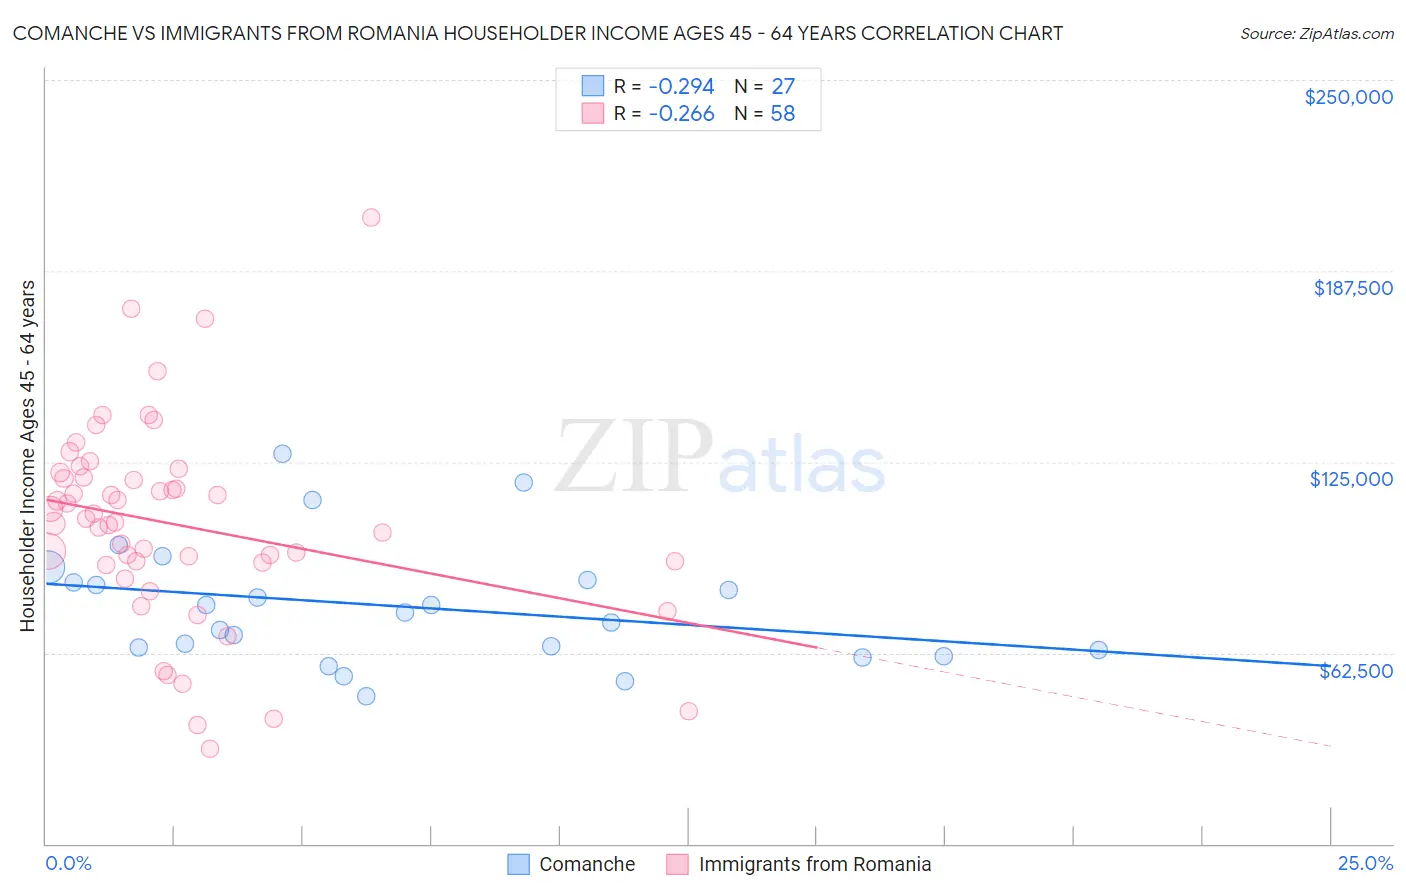
Comanche vs Immigrants from Romania Householder Income Ages 45 - 64 years Correlation Chart
The statistical analysis conducted on geographies consisting of 109,696,818 people shows a weak negative correlation between the proportion of Comanche and household income with householder between the ages 45 and 64 in the United States with a correlation coefficient (R) of -0.294 and weighted average of $85,787. Similarly, the statistical analysis conducted on geographies consisting of 256,866,242 people shows a weak negative correlation between the proportion of Immigrants from Romania and household income with householder between the ages 45 and 64 in the United States with a correlation coefficient (R) of -0.266 and weighted average of $110,633, a difference of 29.0%.
Householder Income Ages 45 - 64 years Correlation Summary
| Measurement | Comanche | Immigrants from Romania |
| Minimum | $48,474 | $31,250 |
| Maximum | $127,559 | $205,179 |
| Range | $79,085 | $173,929 |
| Mean | $77,729 | $104,590 |
| Median | $75,610 | $105,645 |
| Interquartile 25% (IQ1) | $63,523 | $91,875 |
| Interquartile 75% (IQ3) | $86,210 | $119,992 |
| Interquartile Range (IQR) | $22,687 | $28,117 |
| Standard Deviation (Sample) | $19,770 | $32,951 |
| Standard Deviation (Population) | $19,400 | $32,666 |
Similar Demographics by Householder Income Ages 45 - 64 years
Demographics Similar to Comanche by Householder Income Ages 45 - 64 years
In terms of householder income ages 45 - 64 years, the demographic groups most similar to Comanche are Immigrants from Central America ($85,965, a difference of 0.21%), Hispanic or Latino ($86,006, a difference of 0.25%), British West Indian ($85,571, a difference of 0.25%), Immigrants from Grenada ($85,552, a difference of 0.27%), and Cherokee ($86,125, a difference of 0.39%).
| Demographics | Rating | Rank | Householder Income Ages 45 - 64 years |
| Immigrants | Guatemala | 0.1 /100 | #286 | Tragic $86,573 |
| Bangladeshis | 0.1 /100 | #287 | Tragic $86,402 |
| Immigrants | St. Vincent and the Grenadines | 0.1 /100 | #288 | Tragic $86,394 |
| Cubans | 0.1 /100 | #289 | Tragic $86,301 |
| Cherokee | 0.1 /100 | #290 | Tragic $86,125 |
| Hispanics or Latinos | 0.1 /100 | #291 | Tragic $86,006 |
| Immigrants | Central America | 0.1 /100 | #292 | Tragic $85,965 |
| Comanche | 0.1 /100 | #293 | Tragic $85,787 |
| British West Indians | 0.1 /100 | #294 | Tragic $85,571 |
| Immigrants | Grenada | 0.1 /100 | #295 | Tragic $85,552 |
| Immigrants | Zaire | 0.1 /100 | #296 | Tragic $85,207 |
| Fijians | 0.1 /100 | #297 | Tragic $85,187 |
| Africans | 0.0 /100 | #298 | Tragic $84,925 |
| Immigrants | Mexico | 0.0 /100 | #299 | Tragic $84,910 |
| Indonesians | 0.0 /100 | #300 | Tragic $84,890 |
Demographics Similar to Immigrants from Romania by Householder Income Ages 45 - 64 years
In terms of householder income ages 45 - 64 years, the demographic groups most similar to Immigrants from Romania are Immigrants from Italy ($110,434, a difference of 0.18%), Korean ($110,334, a difference of 0.27%), Italian ($110,224, a difference of 0.37%), Laotian ($111,051, a difference of 0.38%), and Assyrian/Chaldean/Syriac ($110,201, a difference of 0.39%).
| Demographics | Rating | Rank | Householder Income Ages 45 - 64 years |
| Immigrants | Czechoslovakia | 99.7 /100 | #61 | Exceptional $111,914 |
| Immigrants | Norway | 99.7 /100 | #62 | Exceptional $111,669 |
| Mongolians | 99.6 /100 | #63 | Exceptional $111,602 |
| Immigrants | Latvia | 99.6 /100 | #64 | Exceptional $111,454 |
| Immigrants | Belarus | 99.6 /100 | #65 | Exceptional $111,430 |
| New Zealanders | 99.6 /100 | #66 | Exceptional $111,286 |
| Laotians | 99.5 /100 | #67 | Exceptional $111,051 |
| Immigrants | Romania | 99.4 /100 | #68 | Exceptional $110,633 |
| Immigrants | Italy | 99.4 /100 | #69 | Exceptional $110,434 |
| Koreans | 99.3 /100 | #70 | Exceptional $110,334 |
| Italians | 99.3 /100 | #71 | Exceptional $110,224 |
| Assyrians/Chaldeans/Syriacs | 99.3 /100 | #72 | Exceptional $110,201 |
| Argentineans | 99.3 /100 | #73 | Exceptional $110,103 |
| Immigrants | Egypt | 99.2 /100 | #74 | Exceptional $109,941 |
| South Africans | 99.1 /100 | #75 | Exceptional $109,719 |