Colville vs Immigrants from Fiji Householder Income Under 25 years
COMPARE
Colville
Immigrants from Fiji
Householder Income Under 25 years
Householder Income Under 25 years Comparison
Colville
Immigrants from Fiji
$49,774
HOUSEHOLDER INCOME UNDER 25 YEARS
0.3/ 100
METRIC RATING
272nd/ 347
METRIC RANK
$57,074
HOUSEHOLDER INCOME UNDER 25 YEARS
100.0/ 100
METRIC RATING
21st/ 347
METRIC RANK
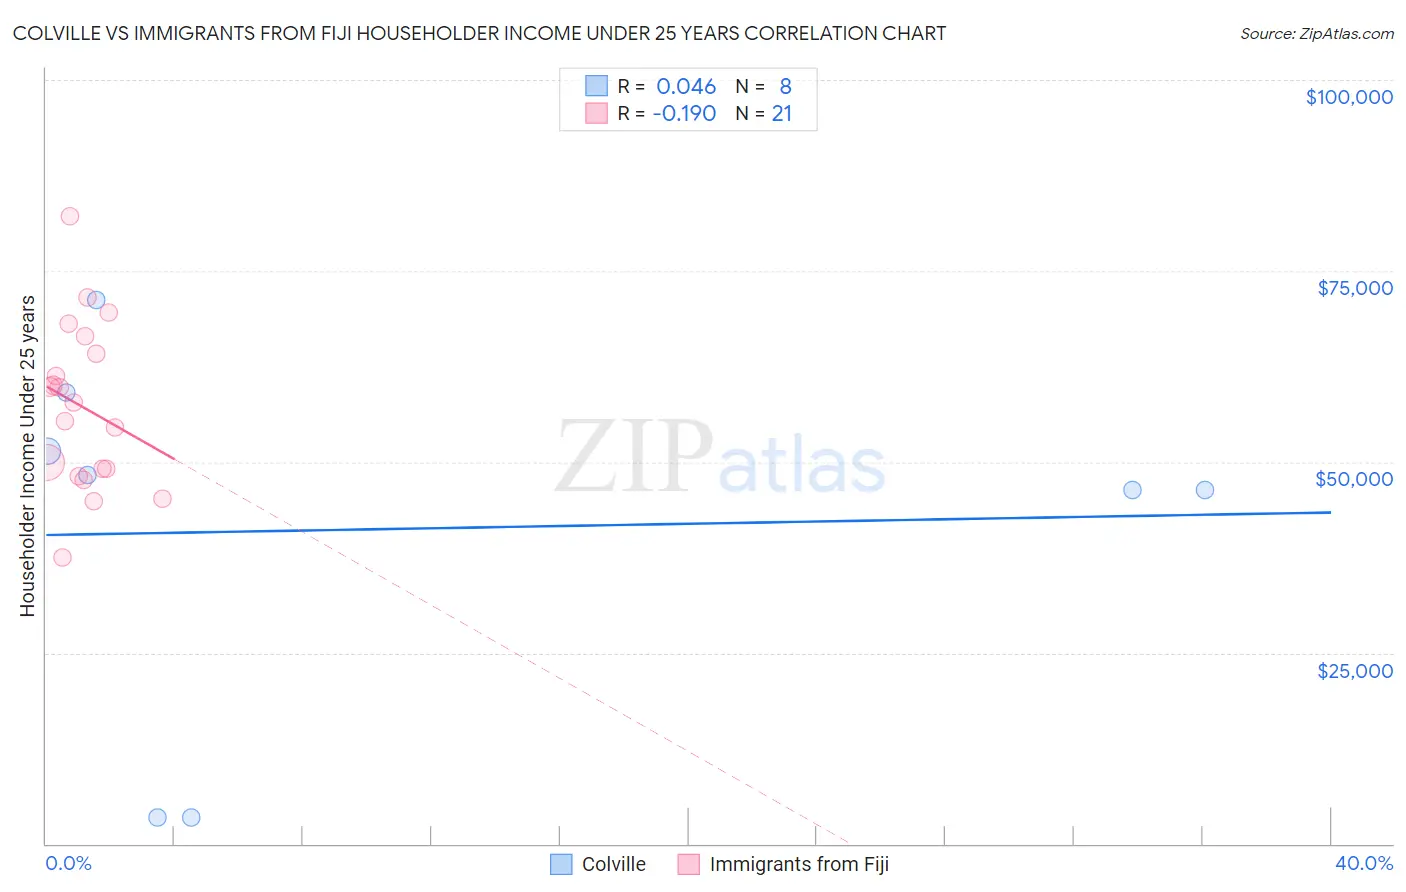
Colville vs Immigrants from Fiji Householder Income Under 25 years Correlation Chart
The statistical analysis conducted on geographies consisting of 33,506,615 people shows no correlation between the proportion of Colville and household income with householder under the age of 25 in the United States with a correlation coefficient (R) of 0.046 and weighted average of $49,774. Similarly, the statistical analysis conducted on geographies consisting of 87,171,556 people shows a poor negative correlation between the proportion of Immigrants from Fiji and household income with householder under the age of 25 in the United States with a correlation coefficient (R) of -0.190 and weighted average of $57,074, a difference of 14.7%.
Householder Income Under 25 years Correlation Summary
| Measurement | Colville | Immigrants from Fiji |
| Minimum | $3,478 | $37,496 |
| Maximum | $71,146 | $82,200 |
| Range | $67,668 | $44,704 |
| Mean | $41,172 | $57,221 |
| Median | $47,292 | $57,721 |
| Interquartile 25% (IQ1) | $24,864 | $48,616 |
| Interquartile 75% (IQ3) | $55,220 | $65,271 |
| Interquartile Range (IQR) | $30,356 | $16,655 |
| Standard Deviation (Sample) | $24,692 | $10,789 |
| Standard Deviation (Population) | $23,097 | $10,529 |
Similar Demographics by Householder Income Under 25 years
Demographics Similar to Colville by Householder Income Under 25 years
In terms of householder income under 25 years, the demographic groups most similar to Colville are Slovak ($49,753, a difference of 0.040%), Taiwanese ($49,804, a difference of 0.060%), Immigrants from Senegal ($49,742, a difference of 0.060%), Immigrants from Kenya ($49,633, a difference of 0.28%), and Dominican ($49,633, a difference of 0.28%).
| Demographics | Rating | Rank | Householder Income Under 25 years |
| Belgians | 0.6 /100 | #265 | Tragic $50,113 |
| Immigrants | Venezuela | 0.6 /100 | #266 | Tragic $50,109 |
| Immigrants | Laos | 0.5 /100 | #267 | Tragic $50,041 |
| Venezuelans | 0.5 /100 | #268 | Tragic $50,011 |
| Ute | 0.5 /100 | #269 | Tragic $49,997 |
| Mexicans | 0.5 /100 | #270 | Tragic $49,989 |
| Taiwanese | 0.3 /100 | #271 | Tragic $49,804 |
| Colville | 0.3 /100 | #272 | Tragic $49,774 |
| Slovaks | 0.3 /100 | #273 | Tragic $49,753 |
| Immigrants | Senegal | 0.3 /100 | #274 | Tragic $49,742 |
| Immigrants | Kenya | 0.2 /100 | #275 | Tragic $49,633 |
| Dominicans | 0.2 /100 | #276 | Tragic $49,633 |
| Immigrants | Western Africa | 0.2 /100 | #277 | Tragic $49,621 |
| Nigerians | 0.1 /100 | #278 | Tragic $49,416 |
| Apache | 0.1 /100 | #279 | Tragic $49,395 |
Demographics Similar to Immigrants from Fiji by Householder Income Under 25 years
In terms of householder income under 25 years, the demographic groups most similar to Immigrants from Fiji are Immigrants from Ireland ($57,075, a difference of 0.0%), Bhutanese ($57,078, a difference of 0.010%), Immigrants from Eastern Asia ($57,123, a difference of 0.090%), Asian ($57,003, a difference of 0.12%), and Tongan ($56,972, a difference of 0.18%).
| Demographics | Rating | Rank | Householder Income Under 25 years |
| Filipinos | 100.0 /100 | #14 | Exceptional $57,740 |
| Koreans | 100.0 /100 | #15 | Exceptional $57,730 |
| Immigrants | Afghanistan | 100.0 /100 | #16 | Exceptional $57,478 |
| Sierra Leoneans | 100.0 /100 | #17 | Exceptional $57,272 |
| Immigrants | Eastern Asia | 100.0 /100 | #18 | Exceptional $57,123 |
| Bhutanese | 100.0 /100 | #19 | Exceptional $57,078 |
| Immigrants | Ireland | 100.0 /100 | #20 | Exceptional $57,075 |
| Immigrants | Fiji | 100.0 /100 | #21 | Exceptional $57,074 |
| Asians | 100.0 /100 | #22 | Exceptional $57,003 |
| Tongans | 100.0 /100 | #23 | Exceptional $56,972 |
| Immigrants | Singapore | 100.0 /100 | #24 | Exceptional $56,835 |
| Immigrants | Pakistan | 100.0 /100 | #25 | Exceptional $56,789 |
| Immigrants | Australia | 100.0 /100 | #26 | Exceptional $56,660 |
| Immigrants | North Macedonia | 100.0 /100 | #27 | Exceptional $56,503 |
| Immigrants | Peru | 100.0 /100 | #28 | Exceptional $56,384 |