Carpatho Rusyn vs Scotch-Irish Householder Income Over 65 years
COMPARE
Carpatho Rusyn
Scotch-Irish
Householder Income Over 65 years
Householder Income Over 65 years Comparison
Carpatho Rusyns
Scotch-Irish
$61,093
HOUSEHOLDER INCOME OVER 65 YEARS
53.3/ 100
METRIC RATING
169th/ 347
METRIC RANK
$59,447
HOUSEHOLDER INCOME OVER 65 YEARS
16.9/ 100
METRIC RATING
203rd/ 347
METRIC RANK
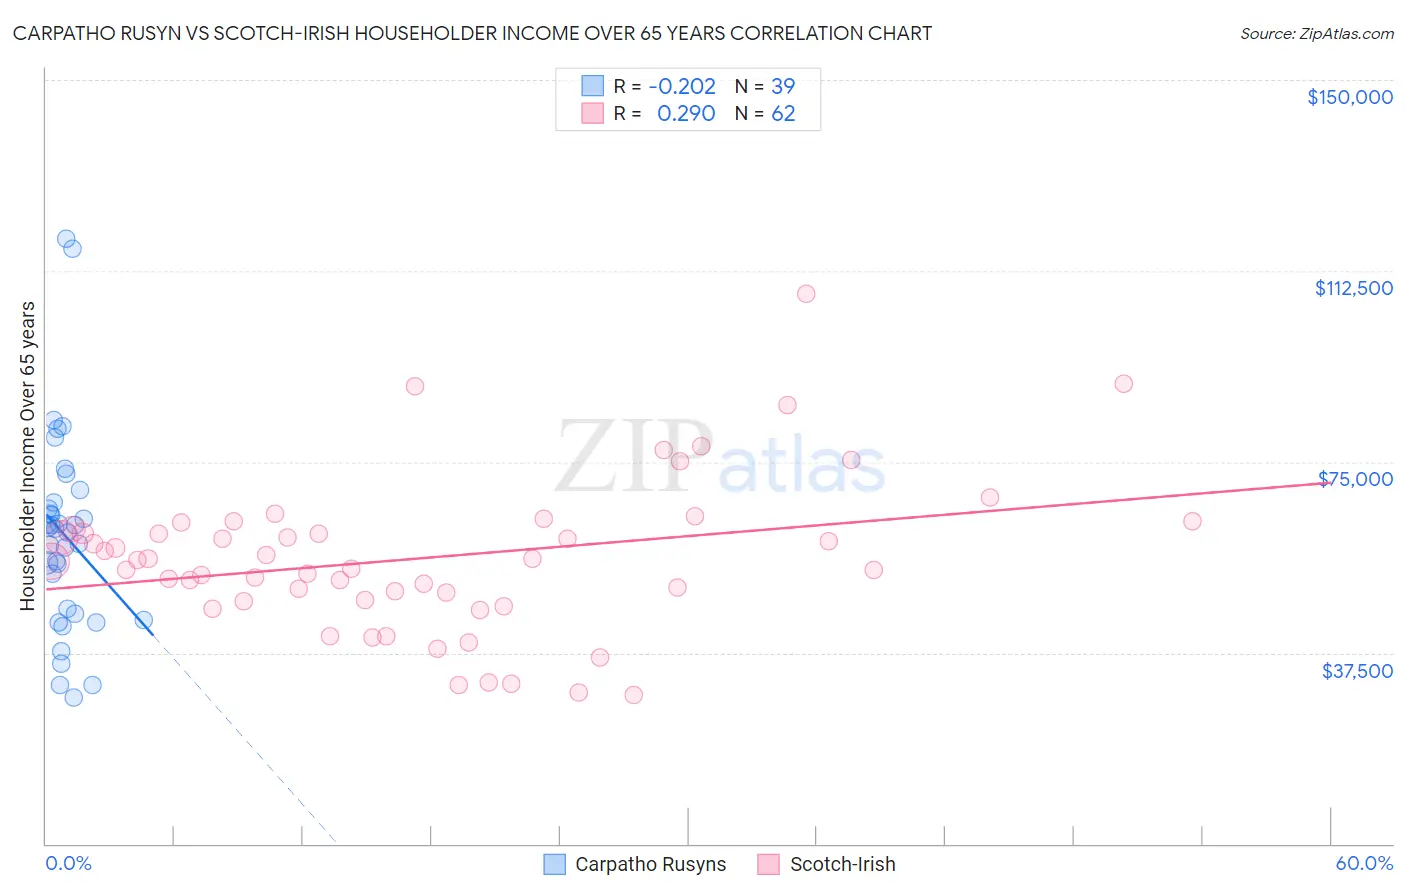
Carpatho Rusyn vs Scotch-Irish Householder Income Over 65 years Correlation Chart
The statistical analysis conducted on geographies consisting of 58,852,207 people shows a weak negative correlation between the proportion of Carpatho Rusyns and household income with householder over the age of 65 in the United States with a correlation coefficient (R) of -0.202 and weighted average of $61,093. Similarly, the statistical analysis conducted on geographies consisting of 544,677,827 people shows a weak positive correlation between the proportion of Scotch-Irish and household income with householder over the age of 65 in the United States with a correlation coefficient (R) of 0.290 and weighted average of $59,447, a difference of 2.8%.
Householder Income Over 65 years Correlation Summary
| Measurement | Carpatho Rusyn | Scotch-Irish |
| Minimum | $28,606 | $29,123 |
| Maximum | $118,750 | $108,125 |
| Range | $90,144 | $79,002 |
| Mean | $60,576 | $56,120 |
| Median | $61,884 | $55,574 |
| Interquartile 25% (IQ1) | $45,096 | $47,845 |
| Interquartile 75% (IQ3) | $66,922 | $61,936 |
| Interquartile Range (IQR) | $21,826 | $14,091 |
| Standard Deviation (Sample) | $19,565 | $15,113 |
| Standard Deviation (Population) | $19,313 | $14,991 |
Similar Demographics by Householder Income Over 65 years
Demographics Similar to Carpatho Rusyns by Householder Income Over 65 years
In terms of householder income over 65 years, the demographic groups most similar to Carpatho Rusyns are Irish ($61,097, a difference of 0.010%), Serbian ($61,087, a difference of 0.010%), Norwegian ($61,104, a difference of 0.020%), Inupiat ($61,061, a difference of 0.050%), and Immigrants from Poland ($61,041, a difference of 0.090%).
| Demographics | Rating | Rank | Householder Income Over 65 years |
| Czechs | 57.2 /100 | #162 | Average $61,244 |
| Ugandans | 55.5 /100 | #163 | Average $61,177 |
| Immigrants | North Macedonia | 55.4 /100 | #164 | Average $61,175 |
| Immigrants | Ukraine | 55.1 /100 | #165 | Average $61,163 |
| Immigrants | Eastern Africa | 55.0 /100 | #166 | Average $61,157 |
| Norwegians | 53.6 /100 | #167 | Average $61,104 |
| Irish | 53.4 /100 | #168 | Average $61,097 |
| Carpatho Rusyns | 53.3 /100 | #169 | Average $61,093 |
| Serbians | 53.1 /100 | #170 | Average $61,087 |
| Inupiat | 52.4 /100 | #171 | Average $61,061 |
| Immigrants | Poland | 51.9 /100 | #172 | Average $61,041 |
| Immigrants | Micronesia | 50.8 /100 | #173 | Average $61,000 |
| Luxembourgers | 50.0 /100 | #174 | Average $60,967 |
| Spaniards | 47.3 /100 | #175 | Average $60,866 |
| Spanish | 45.5 /100 | #176 | Average $60,795 |
Demographics Similar to Scotch-Irish by Householder Income Over 65 years
In terms of householder income over 65 years, the demographic groups most similar to Scotch-Irish are Arapaho ($59,383, a difference of 0.11%), Dutch ($59,539, a difference of 0.15%), Finnish ($59,535, a difference of 0.15%), Immigrants from Sudan ($59,248, a difference of 0.34%), and Immigrants ($59,656, a difference of 0.35%).
| Demographics | Rating | Rank | Householder Income Over 65 years |
| Germans | 21.5 /100 | #196 | Fair $59,730 |
| Immigrants | Kenya | 21.1 /100 | #197 | Fair $59,710 |
| Moroccans | 20.7 /100 | #198 | Fair $59,683 |
| Immigrants | Immigrants | 20.2 /100 | #199 | Fair $59,656 |
| French | 20.2 /100 | #200 | Fair $59,656 |
| Dutch | 18.3 /100 | #201 | Poor $59,539 |
| Finns | 18.2 /100 | #202 | Poor $59,535 |
| Scotch-Irish | 16.9 /100 | #203 | Poor $59,447 |
| Arapaho | 16.0 /100 | #204 | Poor $59,383 |
| Immigrants | Sudan | 14.2 /100 | #205 | Poor $59,248 |
| Immigrants | South America | 13.0 /100 | #206 | Poor $59,151 |
| Salvadorans | 12.9 /100 | #207 | Poor $59,141 |
| Uruguayans | 12.3 /100 | #208 | Poor $59,090 |
| Slovaks | 11.7 /100 | #209 | Poor $59,039 |
| Nigerians | 11.2 /100 | #210 | Poor $58,992 |