Cambodian vs English Householder Income Ages 25 - 44 years
COMPARE
Cambodian
English
Householder Income Ages 25 - 44 years
Householder Income Ages 25 - 44 years Comparison
Cambodians
English
$107,148
HOUSEHOLDER INCOME AGES 25 - 44 YEARS
99.9/ 100
METRIC RATING
50th/ 347
METRIC RANK
$94,429
HOUSEHOLDER INCOME AGES 25 - 44 YEARS
48.1/ 100
METRIC RATING
175th/ 347
METRIC RANK
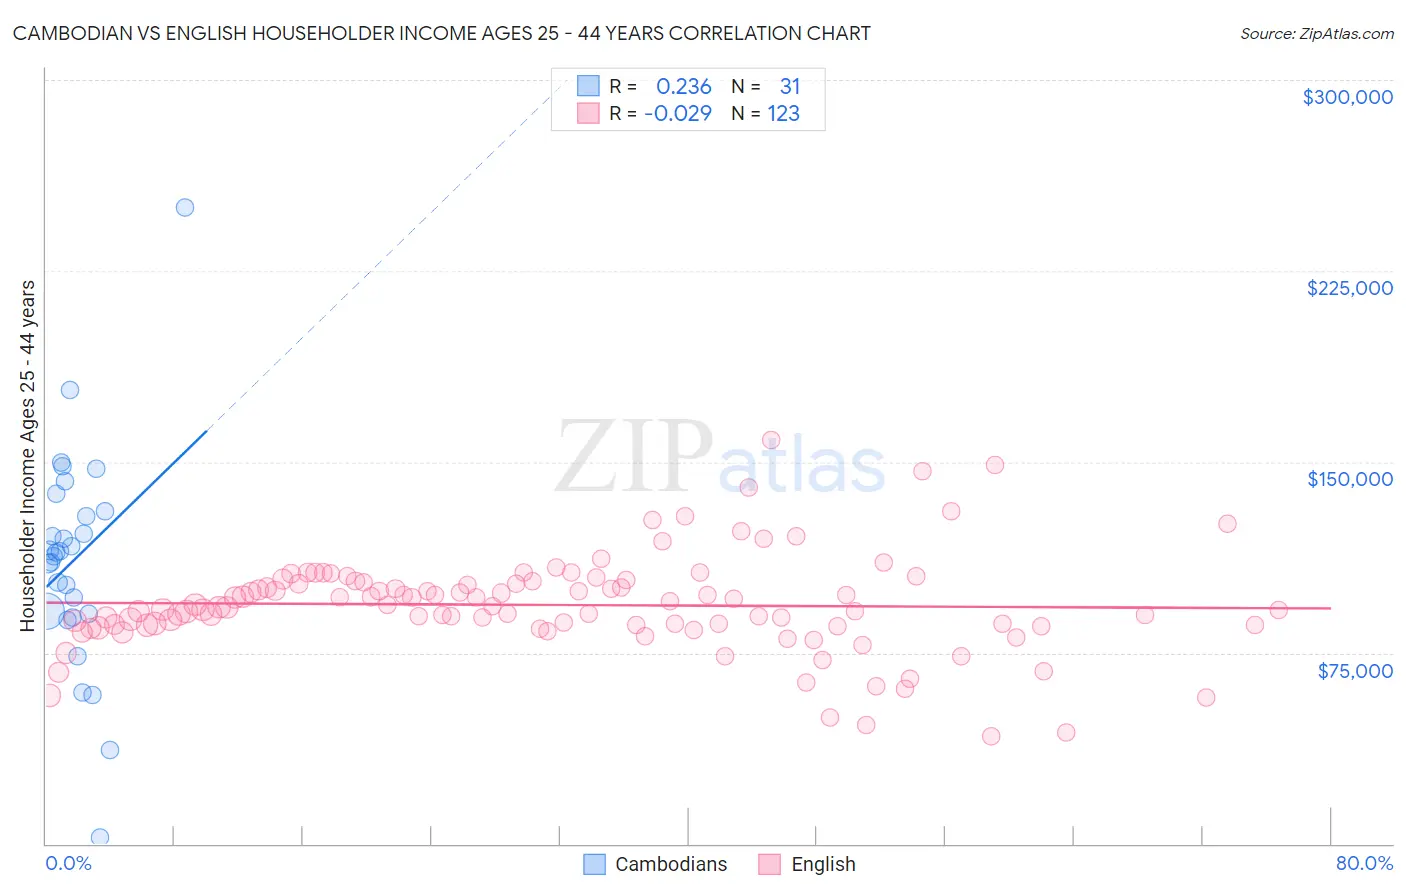
Cambodian vs English Householder Income Ages 25 - 44 years Correlation Chart
The statistical analysis conducted on geographies consisting of 102,421,447 people shows a weak positive correlation between the proportion of Cambodians and household income with householder between the ages 25 and 44 in the United States with a correlation coefficient (R) of 0.236 and weighted average of $107,148. Similarly, the statistical analysis conducted on geographies consisting of 572,215,792 people shows no correlation between the proportion of English and household income with householder between the ages 25 and 44 in the United States with a correlation coefficient (R) of -0.029 and weighted average of $94,429, a difference of 13.5%.
Householder Income Ages 25 - 44 years Correlation Summary
| Measurement | Cambodian | English |
| Minimum | $2,499 | $42,449 |
| Maximum | $250,001 | $158,706 |
| Range | $247,502 | $116,258 |
| Mean | $111,649 | $93,802 |
| Median | $114,305 | $92,861 |
| Interquartile 25% (IQ1) | $90,341 | $85,879 |
| Interquartile 75% (IQ3) | $130,756 | $102,574 |
| Interquartile Range (IQR) | $40,415 | $16,695 |
| Standard Deviation (Sample) | $43,612 | $19,146 |
| Standard Deviation (Population) | $42,903 | $19,068 |
Similar Demographics by Householder Income Ages 25 - 44 years
Demographics Similar to Cambodians by Householder Income Ages 25 - 44 years
In terms of householder income ages 25 - 44 years, the demographic groups most similar to Cambodians are Immigrants from Turkey ($107,258, a difference of 0.10%), Estonian ($107,269, a difference of 0.11%), Bulgarian ($107,264, a difference of 0.11%), Immigrants from Belarus ($107,393, a difference of 0.23%), and Immigrants from Czechoslovakia ($106,888, a difference of 0.24%).
| Demographics | Rating | Rank | Householder Income Ages 25 - 44 years |
| Immigrants | Malaysia | 99.9 /100 | #43 | Exceptional $107,650 |
| Immigrants | Indonesia | 99.9 /100 | #44 | Exceptional $107,627 |
| Israelis | 99.9 /100 | #45 | Exceptional $107,579 |
| Immigrants | Belarus | 99.9 /100 | #46 | Exceptional $107,393 |
| Estonians | 99.9 /100 | #47 | Exceptional $107,269 |
| Bulgarians | 99.9 /100 | #48 | Exceptional $107,264 |
| Immigrants | Turkey | 99.9 /100 | #49 | Exceptional $107,258 |
| Cambodians | 99.9 /100 | #50 | Exceptional $107,148 |
| Immigrants | Czechoslovakia | 99.9 /100 | #51 | Exceptional $106,888 |
| Immigrants | Europe | 99.9 /100 | #52 | Exceptional $106,817 |
| Immigrants | Norway | 99.9 /100 | #53 | Exceptional $106,629 |
| Paraguayans | 99.9 /100 | #54 | Exceptional $106,615 |
| Greeks | 99.9 /100 | #55 | Exceptional $106,457 |
| Immigrants | Pakistan | 99.8 /100 | #56 | Exceptional $106,129 |
| Immigrants | Austria | 99.8 /100 | #57 | Exceptional $106,103 |
Demographics Similar to English by Householder Income Ages 25 - 44 years
In terms of householder income ages 25 - 44 years, the demographic groups most similar to English are Immigrants ($94,423, a difference of 0.010%), Colombian ($94,565, a difference of 0.14%), Belgian ($94,262, a difference of 0.18%), Finnish ($94,610, a difference of 0.19%), and Scottish ($94,622, a difference of 0.21%).
| Demographics | Rating | Rank | Householder Income Ages 25 - 44 years |
| Alsatians | 56.8 /100 | #168 | Average $95,059 |
| Native Hawaiians | 56.8 /100 | #169 | Average $95,058 |
| Slovaks | 56.4 /100 | #170 | Average $95,032 |
| Immigrants | Armenia | 54.2 /100 | #171 | Average $94,867 |
| Scottish | 50.8 /100 | #172 | Average $94,622 |
| Finns | 50.6 /100 | #173 | Average $94,610 |
| Colombians | 50.0 /100 | #174 | Average $94,565 |
| English | 48.1 /100 | #175 | Average $94,429 |
| Immigrants | Immigrants | 48.0 /100 | #176 | Average $94,423 |
| Belgians | 45.8 /100 | #177 | Average $94,262 |
| Immigrants | South America | 42.8 /100 | #178 | Average $94,042 |
| French Canadians | 38.2 /100 | #179 | Fair $93,694 |
| French | 37.8 /100 | #180 | Fair $93,665 |
| Puget Sound Salish | 37.7 /100 | #181 | Fair $93,661 |
| Uruguayans | 37.3 /100 | #182 | Fair $93,631 |