Tsimshian vs Immigrants from Croatia Single Mother Households
COMPARE
Tsimshian
Immigrants from Croatia
Single Mother Households
Single Mother Households Comparison
Tsimshian
Immigrants from Croatia
6.0%
SINGLE MOTHER HOUSEHOLDS
85.2/ 100
METRIC RATING
141st/ 347
METRIC RANK
5.4%
SINGLE MOTHER HOUSEHOLDS
99.4/ 100
METRIC RATING
45th/ 347
METRIC RANK
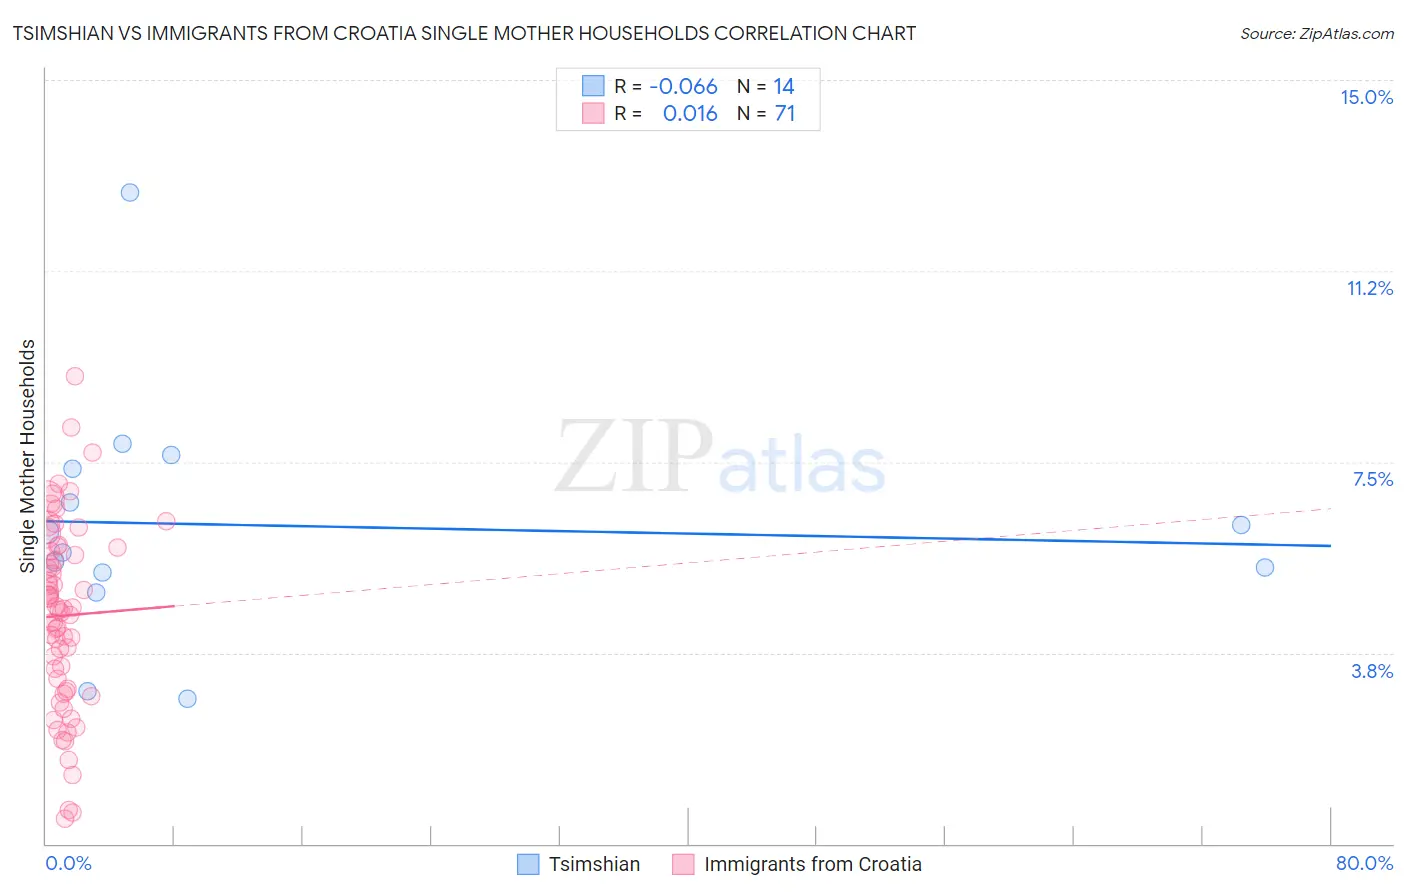
Tsimshian vs Immigrants from Croatia Single Mother Households Correlation Chart
The statistical analysis conducted on geographies consisting of 15,617,285 people shows a slight negative correlation between the proportion of Tsimshian and percentage of single mother households in the United States with a correlation coefficient (R) of -0.066 and weighted average of 6.0%. Similarly, the statistical analysis conducted on geographies consisting of 132,474,478 people shows no correlation between the proportion of Immigrants from Croatia and percentage of single mother households in the United States with a correlation coefficient (R) of 0.016 and weighted average of 5.4%, a difference of 10.4%.
Single Mother Households Correlation Summary
| Measurement | Tsimshian | Immigrants from Croatia |
| Minimum | 2.8% | 0.49% |
| Maximum | 12.8% | 9.2% |
| Range | 10.0% | 8.7% |
| Mean | 6.3% | 4.5% |
| Median | 5.9% | 4.6% |
| Interquartile 25% (IQ1) | 5.3% | 3.0% |
| Interquartile 75% (IQ3) | 7.4% | 5.7% |
| Interquartile Range (IQR) | 2.1% | 2.7% |
| Standard Deviation (Sample) | 2.4% | 1.8% |
| Standard Deviation (Population) | 2.3% | 1.8% |
Similar Demographics by Single Mother Households
Demographics Similar to Tsimshian by Single Mother Households
In terms of single mother households, the demographic groups most similar to Tsimshian are Immigrants from Egypt (6.0%, a difference of 0.050%), Immigrants from Iraq (6.0%, a difference of 0.090%), French (6.0%, a difference of 0.10%), Syrian (6.0%, a difference of 0.17%), and Korean (6.0%, a difference of 0.19%).
| Demographics | Rating | Rank | Single Mother Households |
| Canadians | 90.5 /100 | #134 | Exceptional 5.9% |
| Immigrants | Saudi Arabia | 90.2 /100 | #135 | Exceptional 5.9% |
| Jordanians | 88.9 /100 | #136 | Excellent 6.0% |
| Immigrants | Pakistan | 88.4 /100 | #137 | Excellent 6.0% |
| Icelanders | 86.9 /100 | #138 | Excellent 6.0% |
| Syrians | 86.0 /100 | #139 | Excellent 6.0% |
| French | 85.7 /100 | #140 | Excellent 6.0% |
| Tsimshian | 85.2 /100 | #141 | Excellent 6.0% |
| Immigrants | Egypt | 85.0 /100 | #142 | Excellent 6.0% |
| Immigrants | Iraq | 84.8 /100 | #143 | Excellent 6.0% |
| Koreans | 84.4 /100 | #144 | Excellent 6.0% |
| Arabs | 84.0 /100 | #145 | Excellent 6.0% |
| French Canadians | 82.6 /100 | #146 | Excellent 6.0% |
| Immigrants | Jordan | 82.3 /100 | #147 | Excellent 6.0% |
| Scotch-Irish | 82.0 /100 | #148 | Excellent 6.0% |
Demographics Similar to Immigrants from Croatia by Single Mother Households
In terms of single mother households, the demographic groups most similar to Immigrants from Croatia are Lithuanian (5.4%, a difference of 0.12%), Croatian (5.5%, a difference of 0.26%), Norwegian (5.5%, a difference of 0.44%), Turkish (5.5%, a difference of 0.64%), and Immigrants from Latvia (5.5%, a difference of 0.67%).
| Demographics | Rating | Rank | Single Mother Households |
| Immigrants | Serbia | 99.6 /100 | #38 | Exceptional 5.4% |
| Immigrants | Sweden | 99.6 /100 | #39 | Exceptional 5.4% |
| Estonians | 99.6 /100 | #40 | Exceptional 5.4% |
| Immigrants | Greece | 99.5 /100 | #41 | Exceptional 5.4% |
| Macedonians | 99.5 /100 | #42 | Exceptional 5.4% |
| Immigrants | South Central Asia | 99.5 /100 | #43 | Exceptional 5.4% |
| Lithuanians | 99.4 /100 | #44 | Exceptional 5.4% |
| Immigrants | Croatia | 99.4 /100 | #45 | Exceptional 5.4% |
| Croatians | 99.3 /100 | #46 | Exceptional 5.5% |
| Norwegians | 99.3 /100 | #47 | Exceptional 5.5% |
| Turks | 99.2 /100 | #48 | Exceptional 5.5% |
| Immigrants | Latvia | 99.2 /100 | #49 | Exceptional 5.5% |
| Immigrants | Scotland | 99.2 /100 | #50 | Exceptional 5.5% |
| Immigrants | Belarus | 99.2 /100 | #51 | Exceptional 5.5% |
| Swedes | 99.1 /100 | #52 | Exceptional 5.5% |