Tohono O'odham vs Immigrants from Brazil Divorced or Separated
COMPARE
Tohono O'odham
Immigrants from Brazil
Divorced or Separated
Divorced or Separated Comparison
Tohono O'odham
Immigrants from Brazil
12.0%
DIVORCED OR SEPARATED
60.4/ 100
METRIC RATING
166th/ 347
METRIC RANK
12.0%
DIVORCED OR SEPARATED
68.8/ 100
METRIC RATING
157th/ 347
METRIC RANK
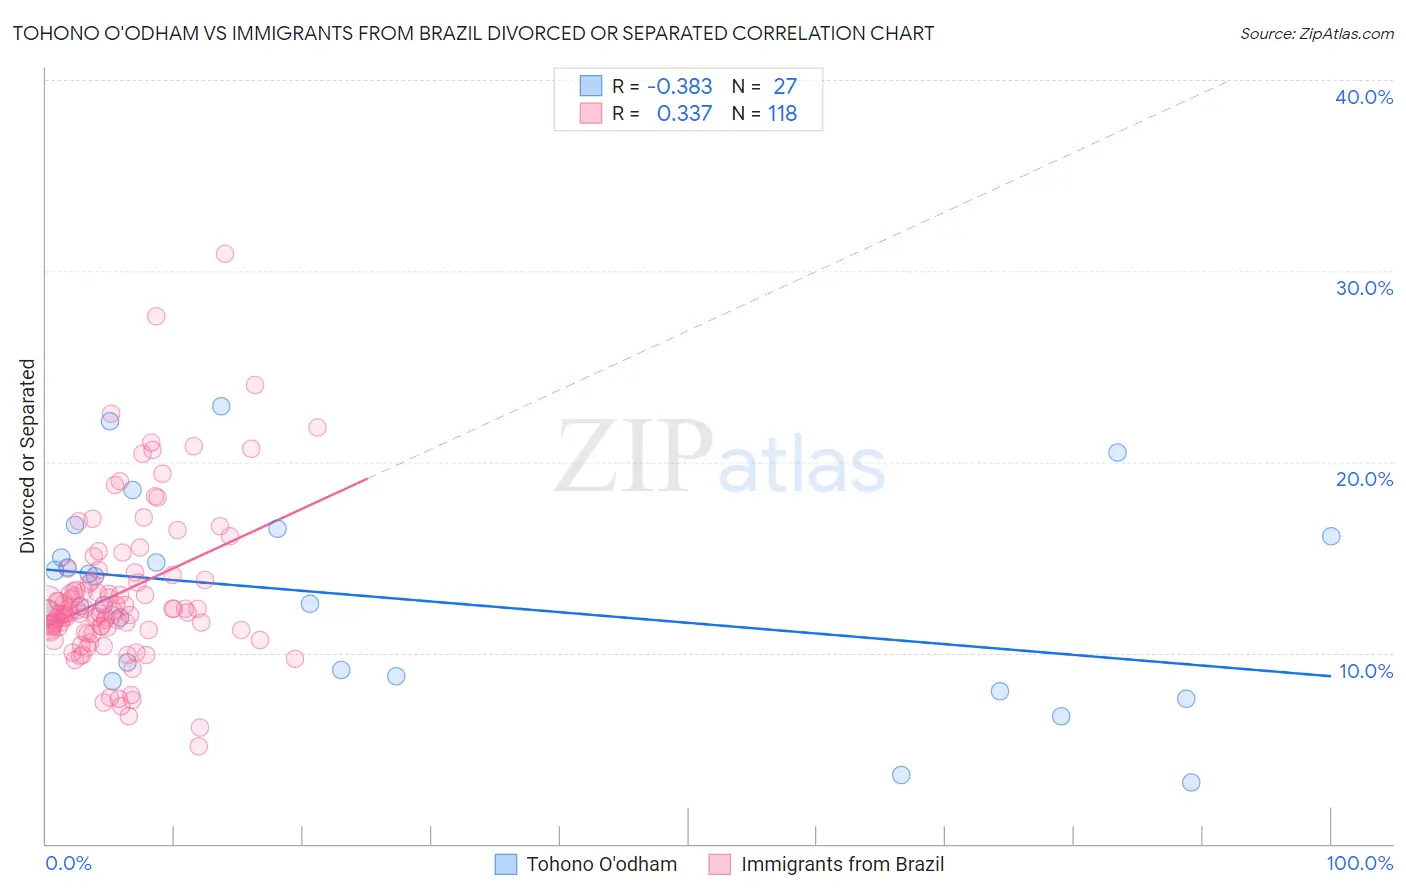
Tohono O'odham vs Immigrants from Brazil Divorced or Separated Correlation Chart
The statistical analysis conducted on geographies consisting of 58,729,123 people shows a mild negative correlation between the proportion of Tohono O'odham and percentage of population currently divorced or separated in the United States with a correlation coefficient (R) of -0.383 and weighted average of 12.0%. Similarly, the statistical analysis conducted on geographies consisting of 342,897,548 people shows a mild positive correlation between the proportion of Immigrants from Brazil and percentage of population currently divorced or separated in the United States with a correlation coefficient (R) of 0.337 and weighted average of 12.0%, a difference of 0.32%.
Divorced or Separated Correlation Summary
| Measurement | Tohono O'odham | Immigrants from Brazil |
| Minimum | 3.2% | 5.1% |
| Maximum | 22.9% | 30.9% |
| Range | 19.7% | 25.8% |
| Mean | 12.8% | 13.1% |
| Median | 12.6% | 12.1% |
| Interquartile 25% (IQ1) | 8.8% | 11.2% |
| Interquartile 75% (IQ3) | 16.1% | 13.8% |
| Interquartile Range (IQR) | 7.3% | 2.6% |
| Standard Deviation (Sample) | 5.0% | 4.1% |
| Standard Deviation (Population) | 5.0% | 4.0% |
Demographics Similar to Tohono O'odham and Immigrants from Brazil by Divorced or Separated
In terms of divorced or separated, the demographic groups most similar to Tohono O'odham are German Russian (12.0%, a difference of 0.050%), Ethiopian (12.0%, a difference of 0.070%), Swiss (12.0%, a difference of 0.12%), Serbian (12.0%, a difference of 0.12%), and Immigrants from Peru (12.0%, a difference of 0.12%). Similarly, the demographic groups most similar to Immigrants from Brazil are Hungarian (12.0%, a difference of 0.060%), Japanese (12.0%, a difference of 0.090%), Chilean (12.0%, a difference of 0.10%), Icelander (12.0%, a difference of 0.11%), and Immigrants from Barbados (12.0%, a difference of 0.11%).
| Demographics | Rating | Rank | Divorced or Separated |
| Czechs | 76.4 /100 | #151 | Good 11.9% |
| Immigrants | Hungary | 73.7 /100 | #152 | Good 11.9% |
| Austrians | 72.2 /100 | #153 | Good 12.0% |
| Chileans | 71.3 /100 | #154 | Good 12.0% |
| Japanese | 70.9 /100 | #155 | Good 12.0% |
| Hungarians | 70.3 /100 | #156 | Good 12.0% |
| Immigrants | Brazil | 68.8 /100 | #157 | Good 12.0% |
| Icelanders | 66.0 /100 | #158 | Good 12.0% |
| Immigrants | Barbados | 66.0 /100 | #159 | Good 12.0% |
| Immigrants | Scotland | 65.8 /100 | #160 | Good 12.0% |
| Marshallese | 64.6 /100 | #161 | Good 12.0% |
| Samoans | 64.3 /100 | #162 | Good 12.0% |
| Navajo | 63.9 /100 | #163 | Good 12.0% |
| Swiss | 63.6 /100 | #164 | Good 12.0% |
| German Russians | 61.8 /100 | #165 | Good 12.0% |
| Tohono O'odham | 60.4 /100 | #166 | Good 12.0% |
| Ethiopians | 58.5 /100 | #167 | Average 12.0% |
| Serbians | 57.1 /100 | #168 | Average 12.0% |
| Immigrants | Peru | 57.0 /100 | #169 | Average 12.0% |
| Mexican American Indians | 55.8 /100 | #170 | Average 12.0% |
| Costa Ricans | 53.3 /100 | #171 | Average 12.0% |