Sudanese vs Immigrants from Colombia Divorced or Separated
COMPARE
Sudanese
Immigrants from Colombia
Divorced or Separated
Divorced or Separated Comparison
Sudanese
Immigrants from Colombia
12.4%
DIVORCED OR SEPARATED
4.0/ 100
METRIC RATING
238th/ 347
METRIC RANK
12.6%
DIVORCED OR SEPARATED
0.6/ 100
METRIC RATING
256th/ 347
METRIC RANK
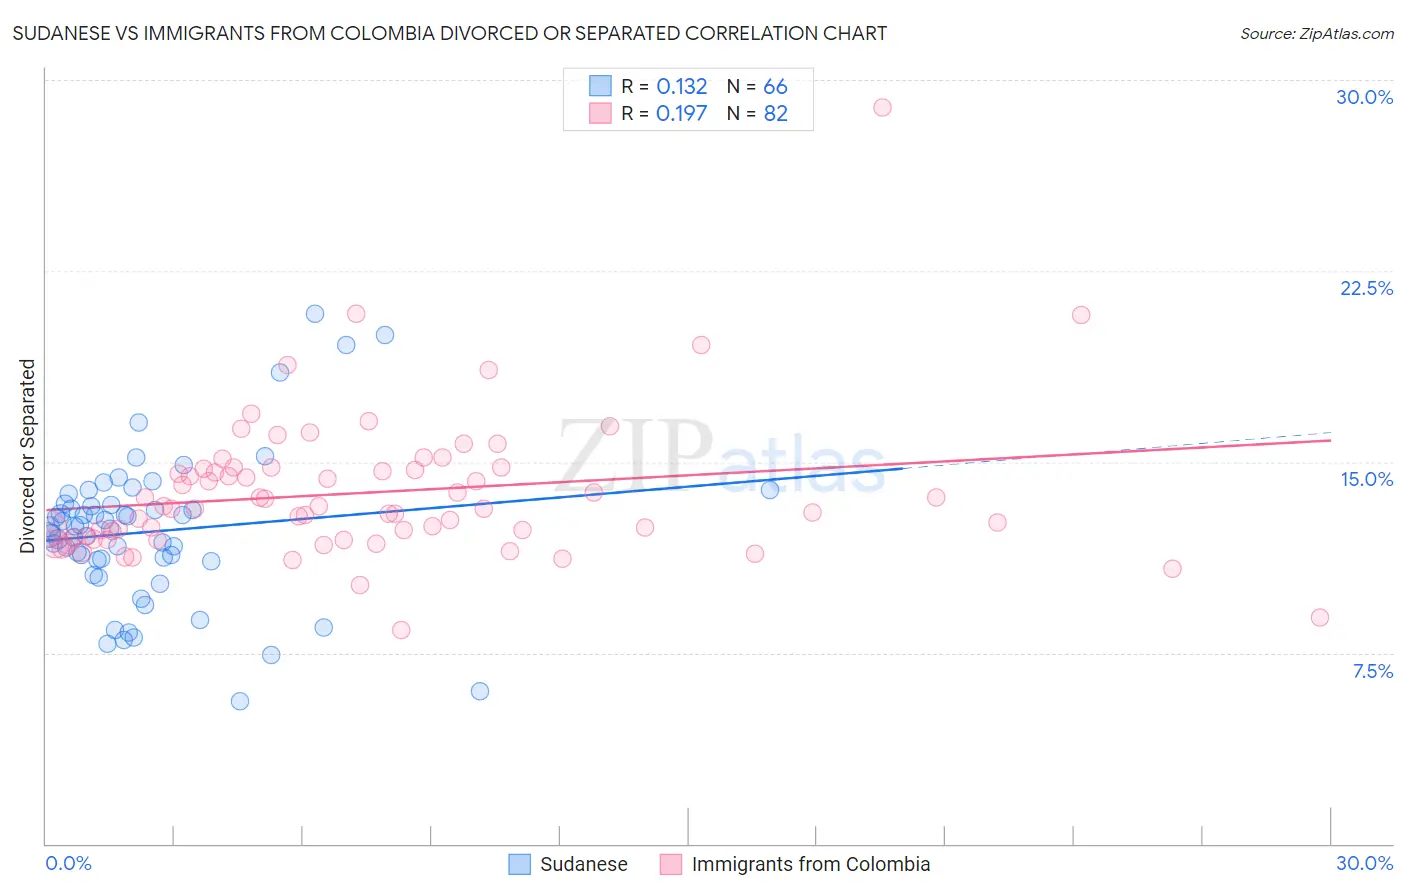
Sudanese vs Immigrants from Colombia Divorced or Separated Correlation Chart
The statistical analysis conducted on geographies consisting of 110,129,778 people shows a poor positive correlation between the proportion of Sudanese and percentage of population currently divorced or separated in the United States with a correlation coefficient (R) of 0.132 and weighted average of 12.4%. Similarly, the statistical analysis conducted on geographies consisting of 378,606,733 people shows a poor positive correlation between the proportion of Immigrants from Colombia and percentage of population currently divorced or separated in the United States with a correlation coefficient (R) of 0.197 and weighted average of 12.6%, a difference of 1.6%.
Divorced or Separated Correlation Summary
| Measurement | Sudanese | Immigrants from Colombia |
| Minimum | 5.6% | 8.4% |
| Maximum | 20.8% | 28.9% |
| Range | 15.2% | 20.5% |
| Mean | 12.3% | 13.8% |
| Median | 12.4% | 13.2% |
| Interquartile 25% (IQ1) | 11.2% | 12.0% |
| Interquartile 75% (IQ3) | 13.3% | 14.7% |
| Interquartile Range (IQR) | 2.1% | 2.7% |
| Standard Deviation (Sample) | 2.9% | 2.8% |
| Standard Deviation (Population) | 2.9% | 2.8% |
Demographics Similar to Sudanese and Immigrants from Colombia by Divorced or Separated
In terms of divorced or separated, the demographic groups most similar to Sudanese are Immigrants from Germany (12.4%, a difference of 0.010%), Immigrants from Laos (12.4%, a difference of 0.030%), British West Indian (12.4%, a difference of 0.060%), Uruguayan (12.4%, a difference of 0.15%), and Dutch (12.4%, a difference of 0.24%). Similarly, the demographic groups most similar to Immigrants from Colombia are Immigrants from Somalia (12.6%, a difference of 0.010%), Welsh (12.6%, a difference of 0.16%), Senegalese (12.6%, a difference of 0.26%), Somali (12.6%, a difference of 0.31%), and Liberian (12.6%, a difference of 0.32%).
| Demographics | Rating | Rank | Divorced or Separated |
| Immigrants | Laos | 4.2 /100 | #237 | Tragic 12.4% |
| Sudanese | 4.0 /100 | #238 | Tragic 12.4% |
| Immigrants | Germany | 4.0 /100 | #239 | Tragic 12.4% |
| British West Indians | 3.7 /100 | #240 | Tragic 12.4% |
| Uruguayans | 3.4 /100 | #241 | Tragic 12.4% |
| Dutch | 3.1 /100 | #242 | Tragic 12.4% |
| Immigrants | Latin America | 2.8 /100 | #243 | Tragic 12.4% |
| Alaska Natives | 2.5 /100 | #244 | Tragic 12.4% |
| Hispanics or Latinos | 2.0 /100 | #245 | Tragic 12.5% |
| Immigrants | West Indies | 1.9 /100 | #246 | Tragic 12.5% |
| Germans | 1.8 /100 | #247 | Tragic 12.5% |
| Nepalese | 1.8 /100 | #248 | Tragic 12.5% |
| Finns | 1.8 /100 | #249 | Tragic 12.5% |
| Irish | 1.3 /100 | #250 | Tragic 12.5% |
| Aleuts | 1.3 /100 | #251 | Tragic 12.5% |
| Liberians | 0.9 /100 | #252 | Tragic 12.6% |
| Somalis | 0.9 /100 | #253 | Tragic 12.6% |
| Senegalese | 0.8 /100 | #254 | Tragic 12.6% |
| Welsh | 0.7 /100 | #255 | Tragic 12.6% |
| Immigrants | Colombia | 0.6 /100 | #256 | Tragic 12.6% |
| Immigrants | Somalia | 0.6 /100 | #257 | Tragic 12.6% |