Soviet Union vs Immigrants from Italy Currently Married
COMPARE
Soviet Union
Immigrants from Italy
Currently Married
Currently Married Comparison
Soviet Union
Immigrants from Italy
46.2%
CURRENTLY MARRIED
25.7/ 100
METRIC RATING
192nd/ 347
METRIC RANK
47.7%
CURRENTLY MARRIED
92.9/ 100
METRIC RATING
107th/ 347
METRIC RANK
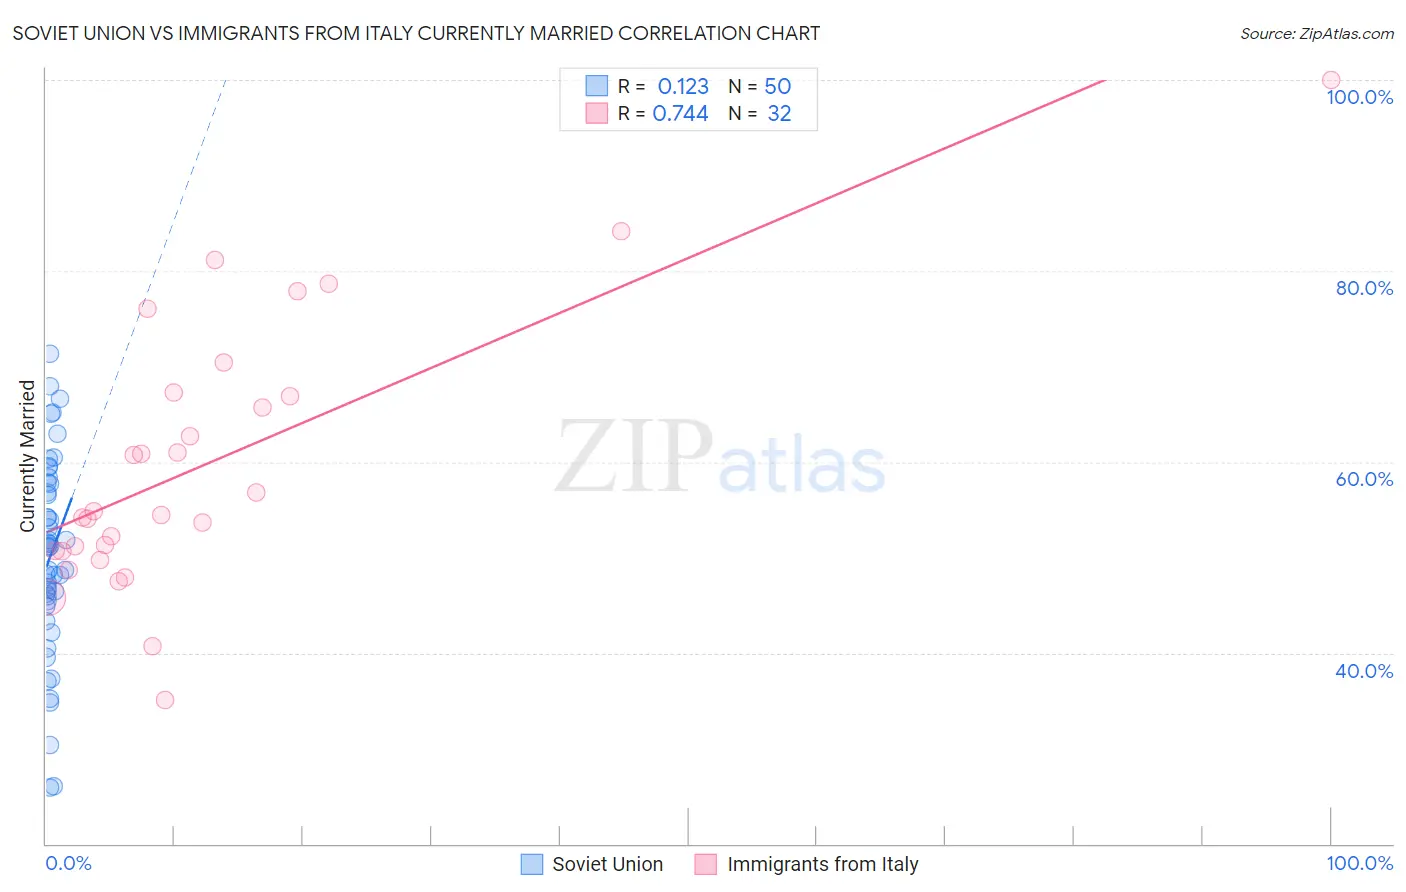
Soviet Union vs Immigrants from Italy Currently Married Correlation Chart
The statistical analysis conducted on geographies consisting of 43,514,626 people shows a poor positive correlation between the proportion of Soviet Union and percentage of population currently married in the United States with a correlation coefficient (R) of 0.123 and weighted average of 46.2%. Similarly, the statistical analysis conducted on geographies consisting of 324,201,882 people shows a strong positive correlation between the proportion of Immigrants from Italy and percentage of population currently married in the United States with a correlation coefficient (R) of 0.744 and weighted average of 47.7%, a difference of 3.4%.
Currently Married Correlation Summary
| Measurement | Soviet Union | Immigrants from Italy |
| Minimum | 25.9% | 35.0% |
| Maximum | 71.3% | 100.0% |
| Range | 45.4% | 65.0% |
| Mean | 50.1% | 59.8% |
| Median | 51.1% | 54.7% |
| Interquartile 25% (IQ1) | 45.4% | 50.7% |
| Interquartile 75% (IQ3) | 57.7% | 67.1% |
| Interquartile Range (IQR) | 12.3% | 16.4% |
| Standard Deviation (Sample) | 10.3% | 14.0% |
| Standard Deviation (Population) | 10.2% | 13.8% |
Similar Demographics by Currently Married
Demographics Similar to Soviet Union by Currently Married
In terms of currently married, the demographic groups most similar to Soviet Union are Immigrants from Fiji (46.2%, a difference of 0.040%), Immigrants from France (46.2%, a difference of 0.090%), South American (46.1%, a difference of 0.10%), Immigrants from Nepal (46.1%, a difference of 0.10%), and Choctaw (46.3%, a difference of 0.16%).
| Demographics | Rating | Rank | Currently Married |
| Mongolians | 37.6 /100 | #185 | Fair 46.4% |
| Immigrants | Chile | 36.8 /100 | #186 | Fair 46.4% |
| Immigrants | Peru | 35.3 /100 | #187 | Fair 46.4% |
| Colombians | 31.8 /100 | #188 | Fair 46.3% |
| Fijians | 30.3 /100 | #189 | Fair 46.3% |
| Choctaw | 29.1 /100 | #190 | Fair 46.3% |
| Immigrants | France | 27.7 /100 | #191 | Fair 46.2% |
| Soviet Union | 25.7 /100 | #192 | Fair 46.2% |
| Immigrants | Fiji | 25.0 /100 | #193 | Fair 46.2% |
| South Americans | 23.8 /100 | #194 | Fair 46.1% |
| Immigrants | Nepal | 23.7 /100 | #195 | Fair 46.1% |
| Immigrants | Bosnia and Herzegovina | 22.2 /100 | #196 | Fair 46.1% |
| Immigrants | Kuwait | 21.7 /100 | #197 | Fair 46.1% |
| Immigrants | Colombia | 21.0 /100 | #198 | Fair 46.1% |
| Immigrants | Costa Rica | 19.6 /100 | #199 | Poor 46.0% |
Demographics Similar to Immigrants from Italy by Currently Married
In terms of currently married, the demographic groups most similar to Immigrants from Italy are Immigrants from Greece (47.7%, a difference of 0.030%), Immigrants from Singapore (47.8%, a difference of 0.060%), Tsimshian (47.7%, a difference of 0.060%), Immigrants from Egypt (47.7%, a difference of 0.080%), and Serbian (47.8%, a difference of 0.11%).
| Demographics | Rating | Rank | Currently Married |
| Celtics | 94.2 /100 | #100 | Exceptional 47.8% |
| Immigrants | Germany | 94.1 /100 | #101 | Exceptional 47.8% |
| Turks | 93.9 /100 | #102 | Exceptional 47.8% |
| Cypriots | 93.7 /100 | #103 | Exceptional 47.8% |
| Serbians | 93.6 /100 | #104 | Exceptional 47.8% |
| Immigrants | Singapore | 93.3 /100 | #105 | Exceptional 47.8% |
| Immigrants | Greece | 93.1 /100 | #106 | Exceptional 47.7% |
| Immigrants | Italy | 92.9 /100 | #107 | Exceptional 47.7% |
| Tsimshian | 92.4 /100 | #108 | Exceptional 47.7% |
| Immigrants | Egypt | 92.3 /100 | #109 | Exceptional 47.7% |
| Immigrants | Russia | 92.0 /100 | #110 | Exceptional 47.7% |
| Immigrants | Hungary | 91.2 /100 | #111 | Exceptional 47.6% |
| Immigrants | Western Europe | 91.1 /100 | #112 | Exceptional 47.6% |
| Immigrants | Denmark | 90.9 /100 | #113 | Exceptional 47.6% |
| South Africans | 90.5 /100 | #114 | Exceptional 47.6% |