South African vs Venezuelan Births to Unmarried Women
COMPARE
South African
Venezuelan
Births to Unmarried Women
Births to Unmarried Women Comparison
South Africans
Venezuelans
30.5%
BIRTHS TO UNMARRIED WOMEN
82.7/ 100
METRIC RATING
142nd/ 347
METRIC RANK
31.7%
BIRTHS TO UNMARRIED WOMEN
50.0/ 100
METRIC RATING
174th/ 347
METRIC RANK
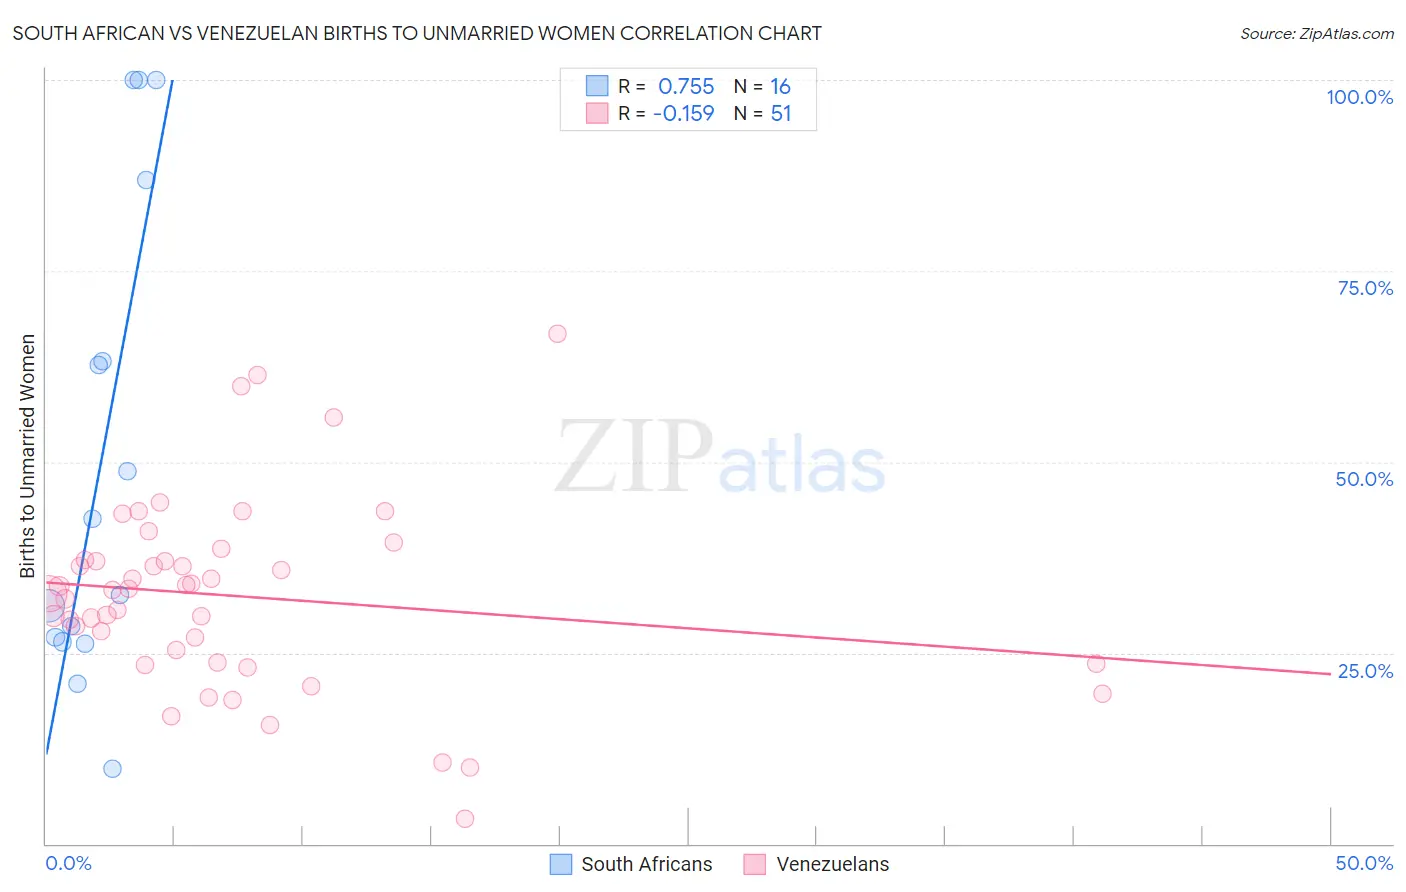
South African vs Venezuelan Births to Unmarried Women Correlation Chart
The statistical analysis conducted on geographies consisting of 173,176,697 people shows a strong positive correlation between the proportion of South Africans and percentage of births to unmarried women in the United States with a correlation coefficient (R) of 0.755 and weighted average of 30.5%. Similarly, the statistical analysis conducted on geographies consisting of 290,839,200 people shows a poor negative correlation between the proportion of Venezuelans and percentage of births to unmarried women in the United States with a correlation coefficient (R) of -0.159 and weighted average of 31.7%, a difference of 3.8%.
Births to Unmarried Women Correlation Summary
| Measurement | South African | Venezuelan |
| Minimum | 9.7% | 3.3% |
| Maximum | 100.0% | 66.7% |
| Range | 90.3% | 63.4% |
| Mean | 50.4% | 32.5% |
| Median | 37.5% | 33.2% |
| Interquartile 25% (IQ1) | 26.7% | 23.7% |
| Interquartile 75% (IQ3) | 75.0% | 37.2% |
| Interquartile Range (IQR) | 48.3% | 13.4% |
| Standard Deviation (Sample) | 31.1% | 12.5% |
| Standard Deviation (Population) | 30.1% | 12.3% |
Similar Demographics by Births to Unmarried Women
Demographics Similar to South Africans by Births to Unmarried Women
In terms of births to unmarried women, the demographic groups most similar to South Africans are Immigrants from Uganda (30.5%, a difference of 0.020%), Pakistani (30.5%, a difference of 0.060%), Swiss (30.5%, a difference of 0.080%), Czech (30.5%, a difference of 0.090%), and Immigrants from Canada (30.4%, a difference of 0.19%).
| Demographics | Rating | Rank | Births to Unmarried Women |
| Brazilians | 84.8 /100 | #135 | Excellent 30.4% |
| Immigrants | Scotland | 84.6 /100 | #136 | Excellent 30.4% |
| Immigrants | Philippines | 83.9 /100 | #137 | Excellent 30.4% |
| Puget Sound Salish | 83.9 /100 | #138 | Excellent 30.4% |
| Immigrants | Canada | 83.7 /100 | #139 | Excellent 30.4% |
| Swiss | 83.1 /100 | #140 | Excellent 30.5% |
| Pakistanis | 83.0 /100 | #141 | Excellent 30.5% |
| South Africans | 82.7 /100 | #142 | Excellent 30.5% |
| Immigrants | Uganda | 82.6 /100 | #143 | Excellent 30.5% |
| Czechs | 82.1 /100 | #144 | Excellent 30.5% |
| Immigrants | North America | 81.5 /100 | #145 | Excellent 30.6% |
| Northern Europeans | 81.4 /100 | #146 | Excellent 30.6% |
| Immigrants | Oceania | 81.2 /100 | #147 | Excellent 30.6% |
| Chileans | 79.1 /100 | #148 | Good 30.7% |
| Serbians | 78.8 /100 | #149 | Good 30.7% |
Demographics Similar to Venezuelans by Births to Unmarried Women
In terms of births to unmarried women, the demographic groups most similar to Venezuelans are Immigrants from Yemen (31.7%, a difference of 0.020%), Immigrants from Eritrea (31.7%, a difference of 0.040%), Finnish (31.7%, a difference of 0.050%), Immigrants from Venezuela (31.7%, a difference of 0.080%), and Guamanian/Chamorro (31.6%, a difference of 0.13%).
| Demographics | Rating | Rank | Births to Unmarried Women |
| Dutch | 55.3 /100 | #167 | Average 31.5% |
| Belgians | 52.4 /100 | #168 | Average 31.6% |
| Slavs | 52.0 /100 | #169 | Average 31.6% |
| Guamanians/Chamorros | 51.3 /100 | #170 | Average 31.6% |
| Finns | 50.5 /100 | #171 | Average 31.7% |
| Immigrants | Eritrea | 50.4 /100 | #172 | Average 31.7% |
| Immigrants | Yemen | 50.2 /100 | #173 | Average 31.7% |
| Venezuelans | 50.0 /100 | #174 | Average 31.7% |
| Immigrants | Venezuela | 49.2 /100 | #175 | Average 31.7% |
| Scottish | 48.1 /100 | #176 | Average 31.7% |
| South American Indians | 47.7 /100 | #177 | Average 31.7% |
| English | 47.4 /100 | #178 | Average 31.7% |
| South Americans | 46.9 /100 | #179 | Average 31.8% |
| Moroccans | 45.7 /100 | #180 | Average 31.8% |
| Immigrants | Peru | 45.1 /100 | #181 | Average 31.8% |