Serbian vs Cuban Family Households with Children
COMPARE
Serbian
Cuban
Family Households with Children
Family Households with Children Comparison
Serbians
Cubans
26.4%
FAMILY HOUSEHOLDS WITH CHILDREN
0.1/ 100
METRIC RATING
302nd/ 347
METRIC RANK
27.1%
FAMILY HOUSEHOLDS WITH CHILDREN
12.2/ 100
METRIC RATING
216th/ 347
METRIC RANK
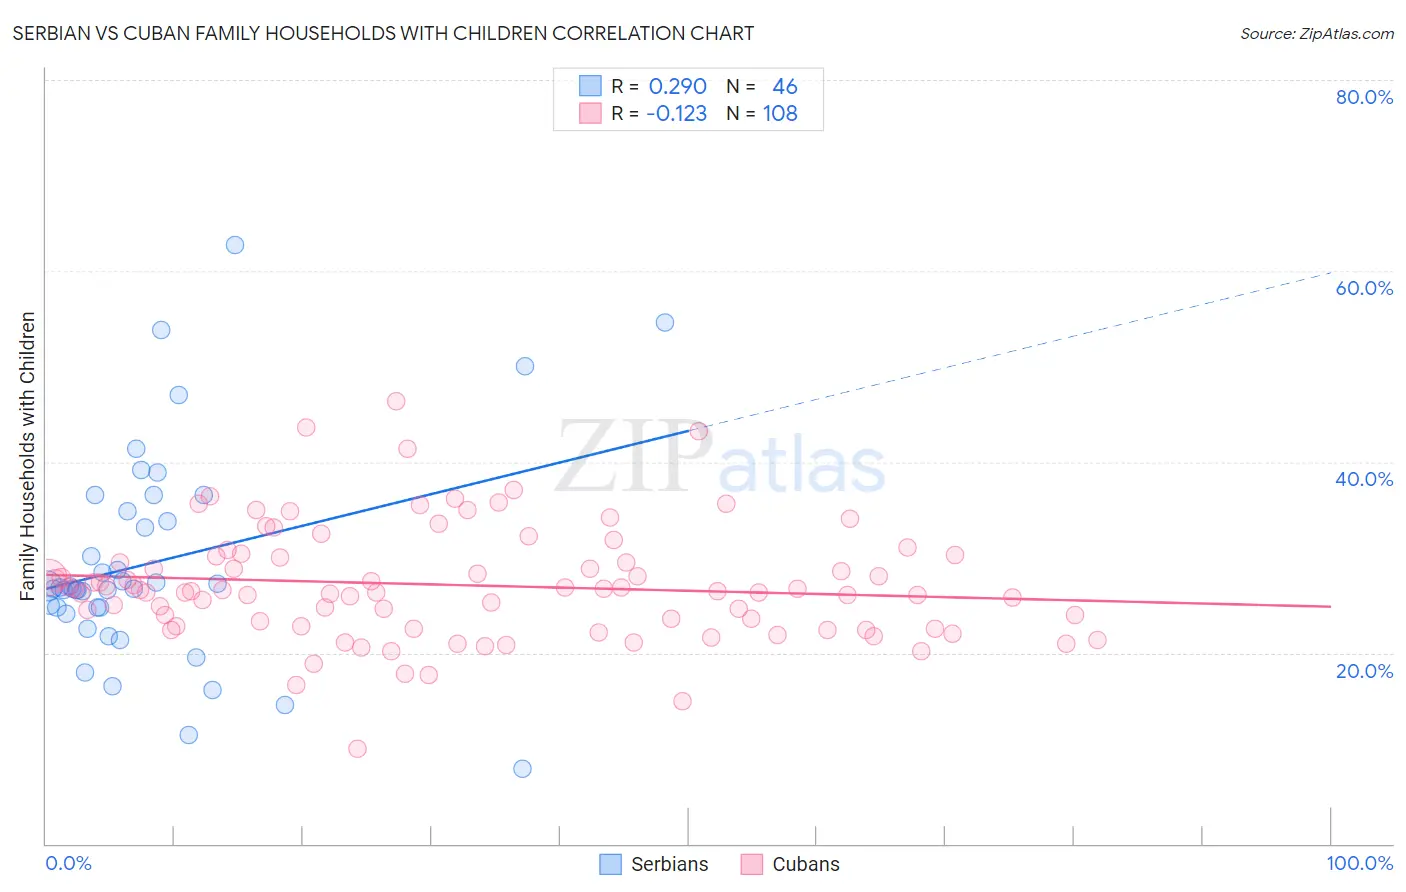
Serbian vs Cuban Family Households with Children Correlation Chart
The statistical analysis conducted on geographies consisting of 267,409,875 people shows a weak positive correlation between the proportion of Serbians and percentage of family households with children in the United States with a correlation coefficient (R) of 0.290 and weighted average of 26.4%. Similarly, the statistical analysis conducted on geographies consisting of 448,752,721 people shows a poor negative correlation between the proportion of Cubans and percentage of family households with children in the United States with a correlation coefficient (R) of -0.123 and weighted average of 27.1%, a difference of 3.0%.
Family Households with Children Correlation Summary
| Measurement | Serbian | Cuban |
| Minimum | 7.8% | 10.0% |
| Maximum | 62.7% | 46.4% |
| Range | 54.8% | 36.4% |
| Mean | 29.5% | 27.1% |
| Median | 26.8% | 26.5% |
| Interquartile 25% (IQ1) | 24.7% | 22.8% |
| Interquartile 75% (IQ3) | 34.8% | 30.1% |
| Interquartile Range (IQR) | 10.1% | 7.3% |
| Standard Deviation (Sample) | 11.1% | 6.0% |
| Standard Deviation (Population) | 11.0% | 6.0% |
Similar Demographics by Family Households with Children
Demographics Similar to Serbians by Family Households with Children
In terms of family households with children, the demographic groups most similar to Serbians are Immigrants from Trinidad and Tobago (26.4%, a difference of 0.010%), Paiute (26.4%, a difference of 0.030%), Immigrants from Guyana (26.3%, a difference of 0.030%), Immigrants from Bahamas (26.3%, a difference of 0.080%), and Guyanese (26.3%, a difference of 0.11%).
| Demographics | Rating | Rank | Family Households with Children |
| Macedonians | 0.1 /100 | #295 | Tragic 26.4% |
| Croatians | 0.1 /100 | #296 | Tragic 26.4% |
| Armenians | 0.1 /100 | #297 | Tragic 26.4% |
| Immigrants | Western Europe | 0.1 /100 | #298 | Tragic 26.4% |
| Trinidadians and Tobagonians | 0.1 /100 | #299 | Tragic 26.4% |
| Paiute | 0.1 /100 | #300 | Tragic 26.4% |
| Immigrants | Trinidad and Tobago | 0.1 /100 | #301 | Tragic 26.4% |
| Serbians | 0.1 /100 | #302 | Tragic 26.4% |
| Immigrants | Guyana | 0.1 /100 | #303 | Tragic 26.3% |
| Immigrants | Bahamas | 0.1 /100 | #304 | Tragic 26.3% |
| Guyanese | 0.1 /100 | #305 | Tragic 26.3% |
| Bermudans | 0.1 /100 | #306 | Tragic 26.3% |
| West Indians | 0.0 /100 | #307 | Tragic 26.3% |
| Lumbee | 0.0 /100 | #308 | Tragic 26.3% |
| Immigrants | Somalia | 0.0 /100 | #309 | Tragic 26.3% |
Demographics Similar to Cubans by Family Households with Children
In terms of family households with children, the demographic groups most similar to Cubans are U.S. Virgin Islander (27.1%, a difference of 0.0%), Northern European (27.2%, a difference of 0.030%), African (27.2%, a difference of 0.040%), Greek (27.1%, a difference of 0.040%), and Immigrants from Dominica (27.2%, a difference of 0.080%).
| Demographics | Rating | Rank | Family Households with Children |
| Dutch West Indians | 15.8 /100 | #209 | Poor 27.2% |
| Immigrants | Ukraine | 14.4 /100 | #210 | Poor 27.2% |
| Welsh | 14.2 /100 | #211 | Poor 27.2% |
| Immigrants | Dominica | 13.9 /100 | #212 | Poor 27.2% |
| Okinawans | 13.7 /100 | #213 | Poor 27.2% |
| Africans | 13.0 /100 | #214 | Poor 27.2% |
| Northern Europeans | 12.8 /100 | #215 | Poor 27.2% |
| Cubans | 12.2 /100 | #216 | Poor 27.1% |
| U.S. Virgin Islanders | 12.1 /100 | #217 | Poor 27.1% |
| Greeks | 11.4 /100 | #218 | Poor 27.1% |
| Immigrants | Japan | 10.7 /100 | #219 | Poor 27.1% |
| Austrians | 9.9 /100 | #220 | Tragic 27.1% |
| New Zealanders | 9.6 /100 | #221 | Tragic 27.1% |
| Paraguayans | 9.4 /100 | #222 | Tragic 27.1% |
| Pima | 9.2 /100 | #223 | Tragic 27.1% |