Salvadoran vs Nepalese Single Mother Households
COMPARE
Salvadoran
Nepalese
Single Mother Households
Single Mother Households Comparison
Salvadorans
Nepalese
7.5%
SINGLE MOTHER HOUSEHOLDS
0.1/ 100
METRIC RATING
271st/ 347
METRIC RANK
7.5%
SINGLE MOTHER HOUSEHOLDS
0.1/ 100
METRIC RATING
266th/ 347
METRIC RANK
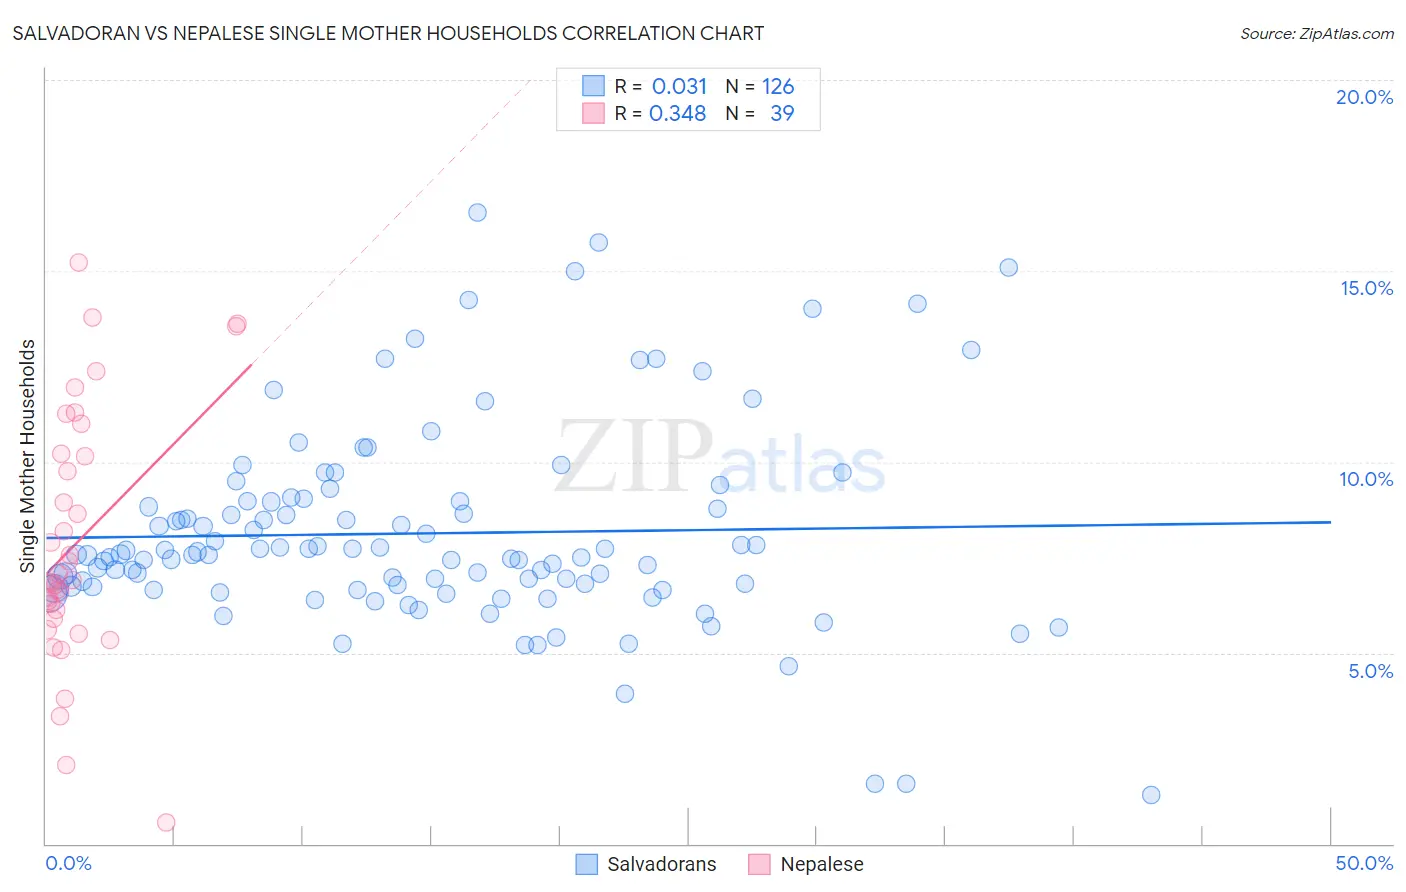
Salvadoran vs Nepalese Single Mother Households Correlation Chart
The statistical analysis conducted on geographies consisting of 398,116,409 people shows no correlation between the proportion of Salvadorans and percentage of single mother households in the United States with a correlation coefficient (R) of 0.031 and weighted average of 7.5%. Similarly, the statistical analysis conducted on geographies consisting of 24,517,800 people shows a mild positive correlation between the proportion of Nepalese and percentage of single mother households in the United States with a correlation coefficient (R) of 0.348 and weighted average of 7.5%, a difference of 1.1%.
Single Mother Households Correlation Summary
| Measurement | Salvadoran | Nepalese |
| Minimum | 1.3% | 0.56% |
| Maximum | 16.5% | 15.2% |
| Range | 15.3% | 14.7% |
| Mean | 8.1% | 7.9% |
| Median | 7.6% | 6.9% |
| Interquartile 25% (IQ1) | 6.7% | 5.9% |
| Interquartile 75% (IQ3) | 9.0% | 10.2% |
| Interquartile Range (IQR) | 2.3% | 4.3% |
| Standard Deviation (Sample) | 2.6% | 3.3% |
| Standard Deviation (Population) | 2.6% | 3.3% |
Demographics Similar to Salvadorans and Nepalese by Single Mother Households
In terms of single mother households, the demographic groups most similar to Salvadorans are Immigrants from the Azores (7.5%, a difference of 0.0%), Immigrants from Cuba (7.5%, a difference of 0.090%), Somali (7.5%, a difference of 0.25%), Belizean (7.6%, a difference of 0.32%), and Immigrants from Guyana (7.6%, a difference of 0.36%). Similarly, the demographic groups most similar to Nepalese are Crow (7.4%, a difference of 0.090%), Yaqui (7.4%, a difference of 0.27%), Blackfeet (7.5%, a difference of 0.34%), Immigrants from Nicaragua (7.4%, a difference of 0.35%), and Indonesian (7.5%, a difference of 0.38%).
| Demographics | Rating | Rank | Single Mother Households |
| Pueblo | 0.2 /100 | #258 | Tragic 7.4% |
| Immigrants | Yemen | 0.2 /100 | #259 | Tragic 7.4% |
| Immigrants | Zaire | 0.2 /100 | #260 | Tragic 7.4% |
| Japanese | 0.2 /100 | #261 | Tragic 7.4% |
| Immigrants | Somalia | 0.2 /100 | #262 | Tragic 7.4% |
| Immigrants | Nicaragua | 0.2 /100 | #263 | Tragic 7.4% |
| Yaqui | 0.1 /100 | #264 | Tragic 7.4% |
| Crow | 0.1 /100 | #265 | Tragic 7.4% |
| Nepalese | 0.1 /100 | #266 | Tragic 7.5% |
| Blackfeet | 0.1 /100 | #267 | Tragic 7.5% |
| Indonesians | 0.1 /100 | #268 | Tragic 7.5% |
| Somalis | 0.1 /100 | #269 | Tragic 7.5% |
| Immigrants | Cuba | 0.1 /100 | #270 | Tragic 7.5% |
| Salvadorans | 0.1 /100 | #271 | Tragic 7.5% |
| Immigrants | Azores | 0.1 /100 | #272 | Tragic 7.5% |
| Belizeans | 0.1 /100 | #273 | Tragic 7.6% |
| Immigrants | Guyana | 0.1 /100 | #274 | Tragic 7.6% |
| Central American Indians | 0.1 /100 | #275 | Tragic 7.6% |
| Guyanese | 0.1 /100 | #276 | Tragic 7.6% |
| Immigrants | Trinidad and Tobago | 0.1 /100 | #277 | Tragic 7.6% |
| Central Americans | 0.1 /100 | #278 | Tragic 7.6% |