Puerto Rican vs Pennsylvania German Single Mother Households
COMPARE
Puerto Rican
Pennsylvania German
Single Mother Households
Single Mother Households Comparison
Puerto Ricans
Pennsylvania Germans
8.7%
SINGLE MOTHER HOUSEHOLDS
0.0/ 100
METRIC RATING
336th/ 347
METRIC RANK
5.8%
SINGLE MOTHER HOUSEHOLDS
94.7/ 100
METRIC RATING
116th/ 347
METRIC RANK
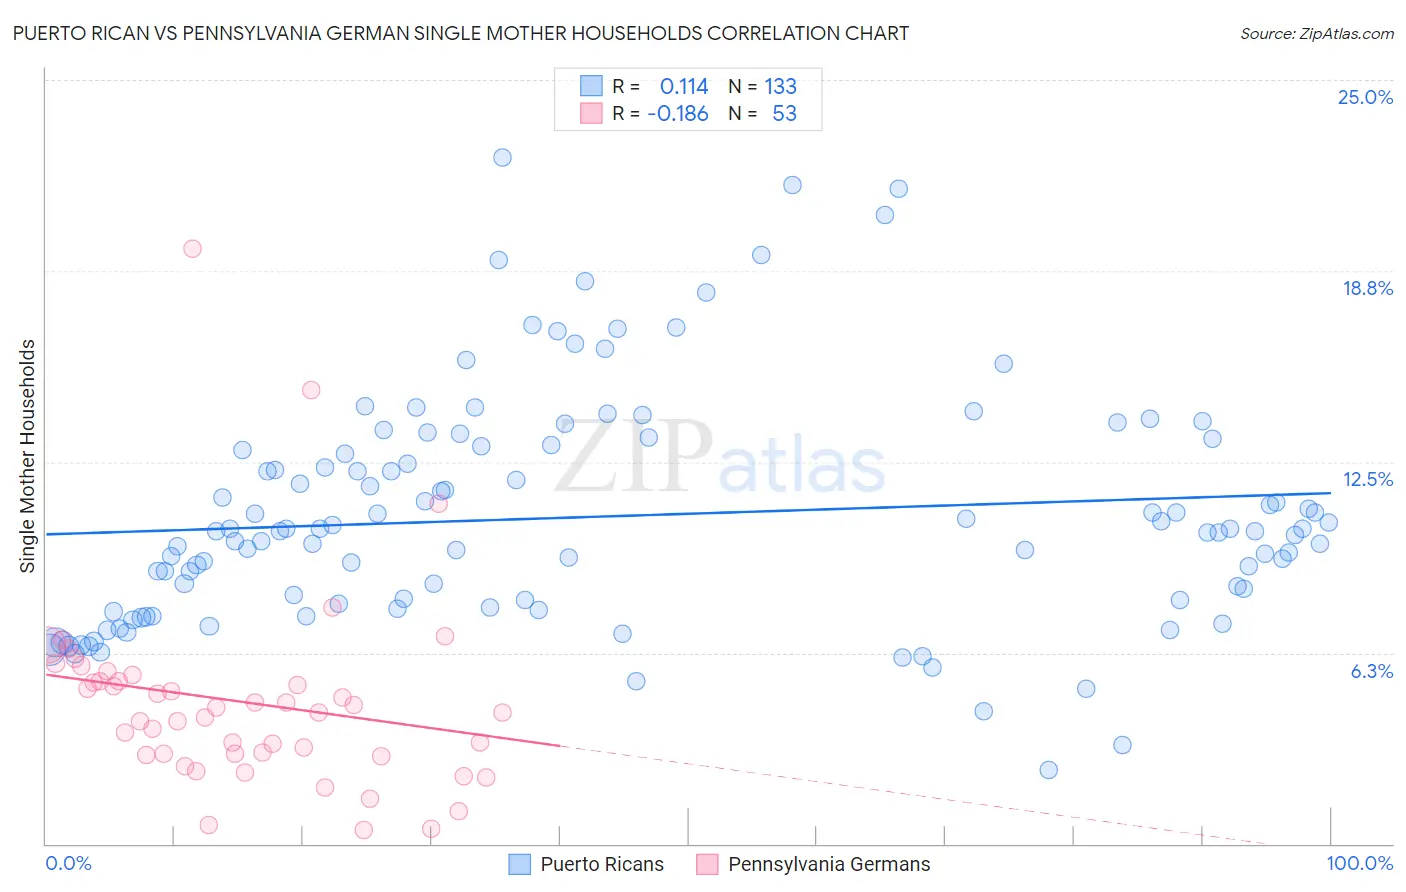
Puerto Rican vs Pennsylvania German Single Mother Households Correlation Chart
The statistical analysis conducted on geographies consisting of 525,510,984 people shows a poor positive correlation between the proportion of Puerto Ricans and percentage of single mother households in the United States with a correlation coefficient (R) of 0.114 and weighted average of 8.7%. Similarly, the statistical analysis conducted on geographies consisting of 233,304,325 people shows a poor negative correlation between the proportion of Pennsylvania Germans and percentage of single mother households in the United States with a correlation coefficient (R) of -0.186 and weighted average of 5.8%, a difference of 50.3%.
Single Mother Households Correlation Summary
| Measurement | Puerto Rican | Pennsylvania German |
| Minimum | 2.4% | 0.44% |
| Maximum | 22.5% | 19.5% |
| Range | 20.0% | 19.0% |
| Mean | 10.7% | 4.6% |
| Median | 10.2% | 4.3% |
| Interquartile 25% (IQ1) | 7.8% | 2.9% |
| Interquartile 75% (IQ3) | 12.9% | 5.4% |
| Interquartile Range (IQR) | 5.1% | 2.5% |
| Standard Deviation (Sample) | 3.8% | 3.2% |
| Standard Deviation (Population) | 3.8% | 3.2% |
Similar Demographics by Single Mother Households
Demographics Similar to Puerto Ricans by Single Mother Households
In terms of single mother households, the demographic groups most similar to Puerto Ricans are Immigrants from Dominica (8.7%, a difference of 0.040%), Immigrants from Liberia (8.7%, a difference of 0.33%), Liberian (8.6%, a difference of 1.1%), Navajo (8.8%, a difference of 1.2%), and Cape Verdean (8.9%, a difference of 1.3%).
| Demographics | Rating | Rank | Single Mother Households |
| Hopi | 0.0 /100 | #329 | Tragic 8.5% |
| Inupiat | 0.0 /100 | #330 | Tragic 8.5% |
| Sioux | 0.0 /100 | #331 | Tragic 8.5% |
| U.S. Virgin Islanders | 0.0 /100 | #332 | Tragic 8.6% |
| Liberians | 0.0 /100 | #333 | Tragic 8.6% |
| Immigrants | Liberia | 0.0 /100 | #334 | Tragic 8.7% |
| Immigrants | Dominica | 0.0 /100 | #335 | Tragic 8.7% |
| Puerto Ricans | 0.0 /100 | #336 | Tragic 8.7% |
| Navajo | 0.0 /100 | #337 | Tragic 8.8% |
| Cape Verdeans | 0.0 /100 | #338 | Tragic 8.9% |
| Blacks/African Americans | 0.0 /100 | #339 | Tragic 9.0% |
| Lumbee | 0.0 /100 | #340 | Tragic 9.1% |
| Tohono O'odham | 0.0 /100 | #341 | Tragic 9.1% |
| Menominee | 0.0 /100 | #342 | Tragic 9.2% |
| Dominicans | 0.0 /100 | #343 | Tragic 9.2% |
Demographics Similar to Pennsylvania Germans by Single Mother Households
In terms of single mother households, the demographic groups most similar to Pennsylvania Germans are Irish (5.8%, a difference of 0.070%), Bolivian (5.8%, a difference of 0.070%), Dutch (5.8%, a difference of 0.25%), Laotian (5.8%, a difference of 0.25%), and South African (5.8%, a difference of 0.36%).
| Demographics | Rating | Rank | Single Mother Households |
| Immigrants | Western Europe | 95.7 /100 | #109 | Exceptional 5.8% |
| British | 95.5 /100 | #110 | Exceptional 5.8% |
| Immigrants | England | 95.5 /100 | #111 | Exceptional 5.8% |
| Immigrants | Kuwait | 95.4 /100 | #112 | Exceptional 5.8% |
| Mongolians | 95.3 /100 | #113 | Exceptional 5.8% |
| Dutch | 95.1 /100 | #114 | Exceptional 5.8% |
| Irish | 94.8 /100 | #115 | Exceptional 5.8% |
| Pennsylvania Germans | 94.7 /100 | #116 | Exceptional 5.8% |
| Bolivians | 94.6 /100 | #117 | Exceptional 5.8% |
| Laotians | 94.3 /100 | #118 | Exceptional 5.8% |
| South Africans | 94.1 /100 | #119 | Exceptional 5.8% |
| Tongans | 93.7 /100 | #120 | Exceptional 5.8% |
| Argentineans | 93.7 /100 | #121 | Exceptional 5.8% |
| Belgians | 93.5 /100 | #122 | Exceptional 5.8% |
| Immigrants | Uzbekistan | 93.4 /100 | #123 | Exceptional 5.9% |