Pennsylvania German vs Guatemalan Family Households
COMPARE
Pennsylvania German
Guatemalan
Family Households
Family Households Comparison
Pennsylvania Germans
Guatemalans
66.1%
FAMILY HOUSEHOLDS
100.0/ 100
METRIC RATING
57th/ 347
METRIC RANK
65.2%
FAMILY HOUSEHOLDS
98.6/ 100
METRIC RATING
97th/ 347
METRIC RANK
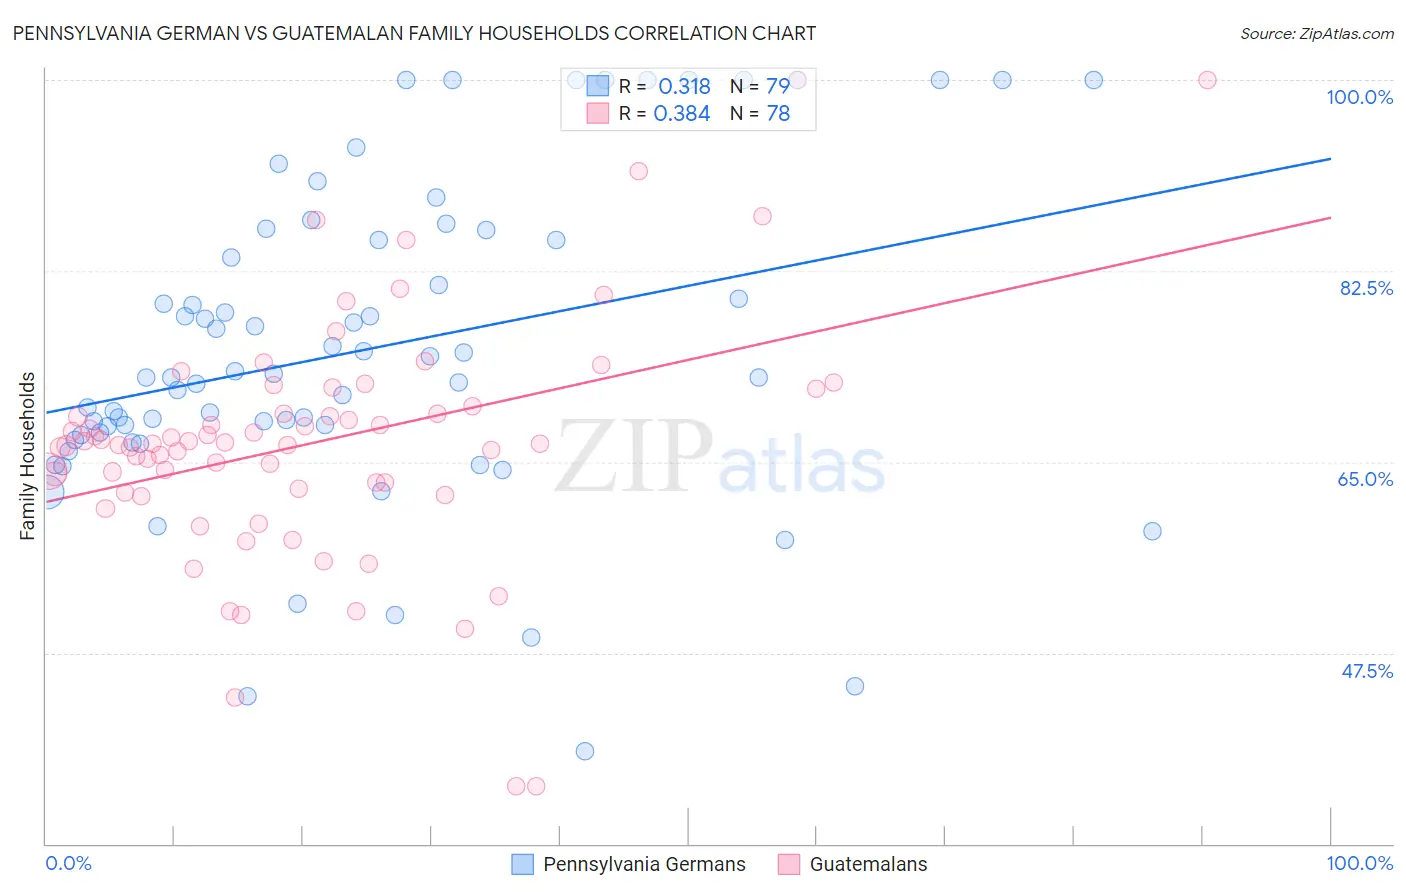
Pennsylvania German vs Guatemalan Family Households Correlation Chart
The statistical analysis conducted on geographies consisting of 234,061,495 people shows a mild positive correlation between the proportion of Pennsylvania Germans and percentage of family households in the United States with a correlation coefficient (R) of 0.318 and weighted average of 66.1%. Similarly, the statistical analysis conducted on geographies consisting of 409,298,089 people shows a mild positive correlation between the proportion of Guatemalans and percentage of family households in the United States with a correlation coefficient (R) of 0.384 and weighted average of 65.2%, a difference of 1.4%.
Family Households Correlation Summary
| Measurement | Pennsylvania German | Guatemalan |
| Minimum | 38.5% | 35.3% |
| Maximum | 100.0% | 100.0% |
| Range | 61.5% | 64.7% |
| Mean | 75.3% | 66.7% |
| Median | 72.8% | 66.6% |
| Interquartile 25% (IQ1) | 67.5% | 62.6% |
| Interquartile 75% (IQ3) | 85.4% | 70.0% |
| Interquartile Range (IQR) | 17.9% | 7.5% |
| Standard Deviation (Sample) | 14.5% | 11.2% |
| Standard Deviation (Population) | 14.4% | 11.1% |
Similar Demographics by Family Households
Demographics Similar to Pennsylvania Germans by Family Households
In terms of family households, the demographic groups most similar to Pennsylvania Germans are Immigrants from Hong Kong (66.1%, a difference of 0.020%), Immigrants (66.1%, a difference of 0.030%), Immigrants from Asia (66.1%, a difference of 0.11%), Immigrants from Korea (66.0%, a difference of 0.12%), and South American (66.0%, a difference of 0.13%).
| Demographics | Rating | Rank | Family Households |
| Navajo | 100.0 /100 | #50 | Exceptional 66.4% |
| Natives/Alaskans | 100.0 /100 | #51 | Exceptional 66.4% |
| Colombians | 100.0 /100 | #52 | Exceptional 66.3% |
| Afghans | 100.0 /100 | #53 | Exceptional 66.3% |
| Immigrants | Colombia | 100.0 /100 | #54 | Exceptional 66.3% |
| Immigrants | Immigrants | 100.0 /100 | #55 | Exceptional 66.1% |
| Immigrants | Hong Kong | 100.0 /100 | #56 | Exceptional 66.1% |
| Pennsylvania Germans | 100.0 /100 | #57 | Exceptional 66.1% |
| Immigrants | Asia | 100.0 /100 | #58 | Exceptional 66.1% |
| Immigrants | Korea | 100.0 /100 | #59 | Exceptional 66.0% |
| South Americans | 100.0 /100 | #60 | Exceptional 66.0% |
| Danes | 100.0 /100 | #61 | Exceptional 66.0% |
| Central Americans | 100.0 /100 | #62 | Exceptional 66.0% |
| Immigrants | Indonesia | 100.0 /100 | #63 | Exceptional 66.0% |
| Pima | 99.9 /100 | #64 | Exceptional 65.9% |
Demographics Similar to Guatemalans by Family Households
In terms of family households, the demographic groups most similar to Guatemalans are Swiss (65.2%, a difference of 0.0%), Immigrants from Portugal (65.2%, a difference of 0.010%), Immigrants from Poland (65.2%, a difference of 0.030%), Immigrants from Syria (65.2%, a difference of 0.040%), and Hopi (65.3%, a difference of 0.050%).
| Demographics | Rating | Rank | Family Households |
| Immigrants | Laos | 99.1 /100 | #90 | Exceptional 65.3% |
| Crow | 98.9 /100 | #91 | Exceptional 65.3% |
| Hopi | 98.8 /100 | #92 | Exceptional 65.3% |
| Guyanese | 98.8 /100 | #93 | Exceptional 65.3% |
| Immigrants | Poland | 98.7 /100 | #94 | Exceptional 65.2% |
| Immigrants | Portugal | 98.6 /100 | #95 | Exceptional 65.2% |
| Swiss | 98.6 /100 | #96 | Exceptional 65.2% |
| Guatemalans | 98.6 /100 | #97 | Exceptional 65.2% |
| Immigrants | Syria | 98.4 /100 | #98 | Exceptional 65.2% |
| Central American Indians | 98.3 /100 | #99 | Exceptional 65.2% |
| Haitians | 98.1 /100 | #100 | Exceptional 65.2% |
| Chileans | 98.1 /100 | #101 | Exceptional 65.2% |
| Immigrants | Sri Lanka | 98.0 /100 | #102 | Exceptional 65.1% |
| Indians (Asian) | 97.9 /100 | #103 | Exceptional 65.1% |
| Spaniards | 97.8 /100 | #104 | Exceptional 65.1% |