Paraguayan vs Immigrants from Russia Family Households with Children
COMPARE
Paraguayan
Immigrants from Russia
Family Households with Children
Family Households with Children Comparison
Paraguayans
Immigrants from Russia
27.1%
FAMILY HOUSEHOLDS WITH CHILDREN
9.4/ 100
METRIC RATING
222nd/ 347
METRIC RANK
26.8%
FAMILY HOUSEHOLDS WITH CHILDREN
1.0/ 100
METRIC RATING
262nd/ 347
METRIC RANK
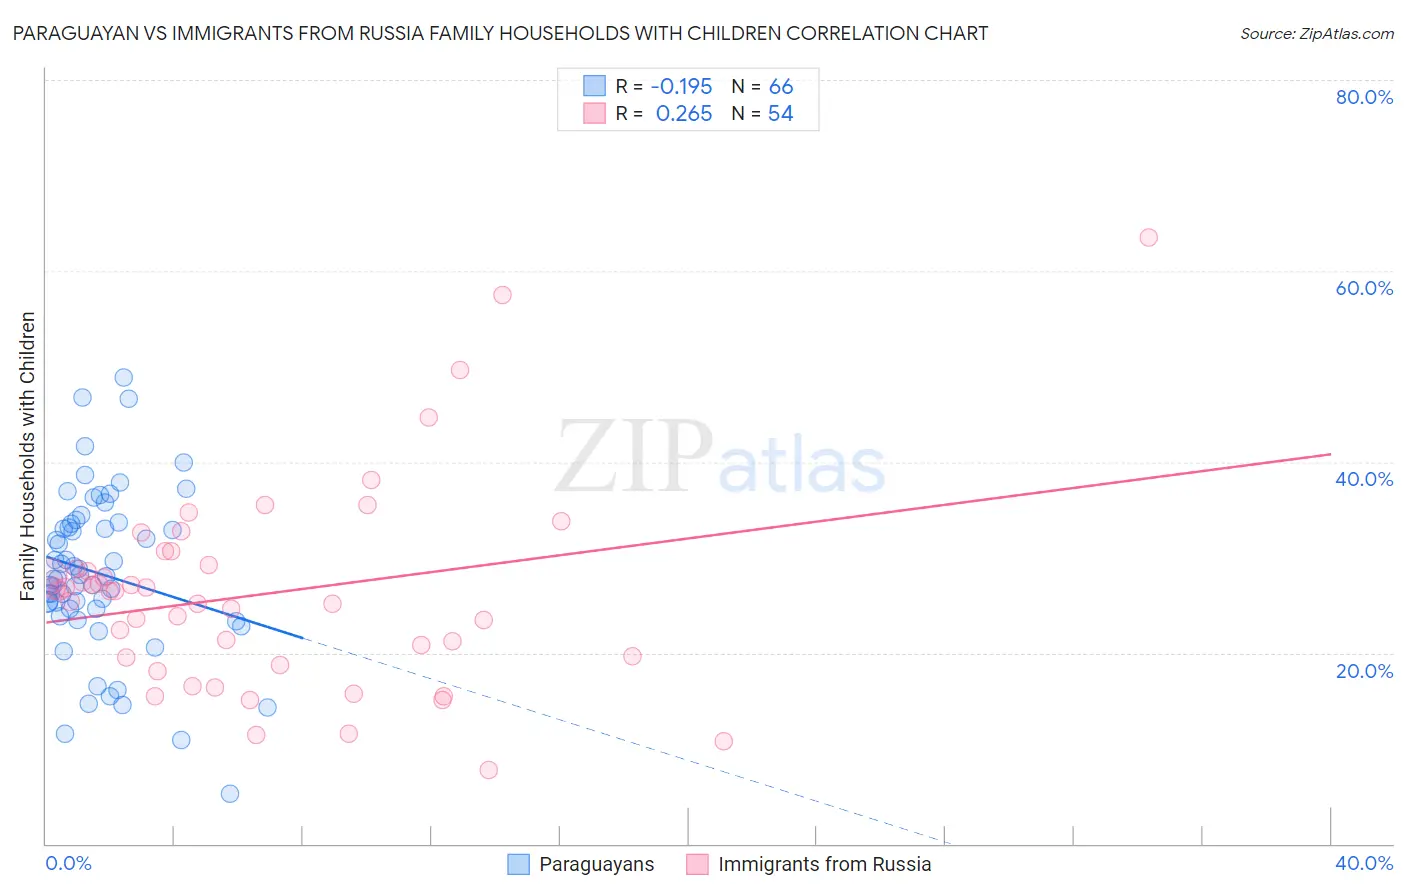
Paraguayan vs Immigrants from Russia Family Households with Children Correlation Chart
The statistical analysis conducted on geographies consisting of 95,067,312 people shows a poor negative correlation between the proportion of Paraguayans and percentage of family households with children in the United States with a correlation coefficient (R) of -0.195 and weighted average of 27.1%. Similarly, the statistical analysis conducted on geographies consisting of 347,605,681 people shows a weak positive correlation between the proportion of Immigrants from Russia and percentage of family households with children in the United States with a correlation coefficient (R) of 0.265 and weighted average of 26.8%, a difference of 1.3%.
Family Households with Children Correlation Summary
| Measurement | Paraguayan | Immigrants from Russia |
| Minimum | 5.3% | 7.7% |
| Maximum | 48.8% | 63.5% |
| Range | 43.5% | 55.8% |
| Mean | 28.3% | 26.2% |
| Median | 27.9% | 26.4% |
| Interquartile 25% (IQ1) | 24.6% | 19.4% |
| Interquartile 75% (IQ3) | 33.5% | 29.2% |
| Interquartile Range (IQR) | 8.9% | 9.7% |
| Standard Deviation (Sample) | 8.6% | 10.6% |
| Standard Deviation (Population) | 8.5% | 10.5% |
Similar Demographics by Family Households with Children
Demographics Similar to Paraguayans by Family Households with Children
In terms of family households with children, the demographic groups most similar to Paraguayans are New Zealander (27.1%, a difference of 0.010%), Pima (27.1%, a difference of 0.010%), Austrian (27.1%, a difference of 0.030%), German (27.1%, a difference of 0.050%), and Immigrants from Japan (27.1%, a difference of 0.080%).
| Demographics | Rating | Rank | Family Households with Children |
| Northern Europeans | 12.8 /100 | #215 | Poor 27.2% |
| Cubans | 12.2 /100 | #216 | Poor 27.1% |
| U.S. Virgin Islanders | 12.1 /100 | #217 | Poor 27.1% |
| Greeks | 11.4 /100 | #218 | Poor 27.1% |
| Immigrants | Japan | 10.7 /100 | #219 | Poor 27.1% |
| Austrians | 9.9 /100 | #220 | Tragic 27.1% |
| New Zealanders | 9.6 /100 | #221 | Tragic 27.1% |
| Paraguayans | 9.4 /100 | #222 | Tragic 27.1% |
| Pima | 9.2 /100 | #223 | Tragic 27.1% |
| Germans | 8.7 /100 | #224 | Tragic 27.1% |
| Canadians | 7.5 /100 | #225 | Tragic 27.1% |
| Czechoslovakians | 6.6 /100 | #226 | Tragic 27.0% |
| Tsimshian | 6.6 /100 | #227 | Tragic 27.0% |
| Scottish | 6.5 /100 | #228 | Tragic 27.0% |
| Immigrants | Caribbean | 6.3 /100 | #229 | Tragic 27.0% |
Demographics Similar to Immigrants from Russia by Family Households with Children
In terms of family households with children, the demographic groups most similar to Immigrants from Russia are Immigrants from North Macedonia (26.7%, a difference of 0.0%), Taiwanese (26.7%, a difference of 0.040%), Chippewa (26.7%, a difference of 0.040%), Maltese (26.7%, a difference of 0.050%), and Immigrants from Uzbekistan (26.7%, a difference of 0.050%).
| Demographics | Rating | Rank | Family Households with Children |
| German Russians | 1.5 /100 | #255 | Tragic 26.8% |
| Scotch-Irish | 1.4 /100 | #256 | Tragic 26.8% |
| Slavs | 1.3 /100 | #257 | Tragic 26.8% |
| Immigrants | Cuba | 1.3 /100 | #258 | Tragic 26.8% |
| Immigrants | Lithuania | 1.2 /100 | #259 | Tragic 26.8% |
| Immigrants | Jamaica | 1.2 /100 | #260 | Tragic 26.8% |
| Immigrants | Belarus | 1.1 /100 | #261 | Tragic 26.8% |
| Immigrants | Russia | 1.0 /100 | #262 | Tragic 26.8% |
| Immigrants | North Macedonia | 1.0 /100 | #263 | Tragic 26.7% |
| Taiwanese | 0.9 /100 | #264 | Tragic 26.7% |
| Chippewa | 0.9 /100 | #265 | Tragic 26.7% |
| Maltese | 0.9 /100 | #266 | Tragic 26.7% |
| Immigrants | Uzbekistan | 0.9 /100 | #267 | Tragic 26.7% |
| Immigrants | Belgium | 0.9 /100 | #268 | Tragic 26.7% |
| Immigrants | Denmark | 0.8 /100 | #269 | Tragic 26.7% |