Okinawan vs Ukrainian Divorced or Separated
COMPARE
Okinawan
Ukrainian
Divorced or Separated
Divorced or Separated Comparison
Okinawans
Ukrainians
10.5%
DIVORCED OR SEPARATED
100.0/ 100
METRIC RATING
12th/ 347
METRIC RANK
11.8%
DIVORCED OR SEPARATED
92.3/ 100
METRIC RATING
125th/ 347
METRIC RANK
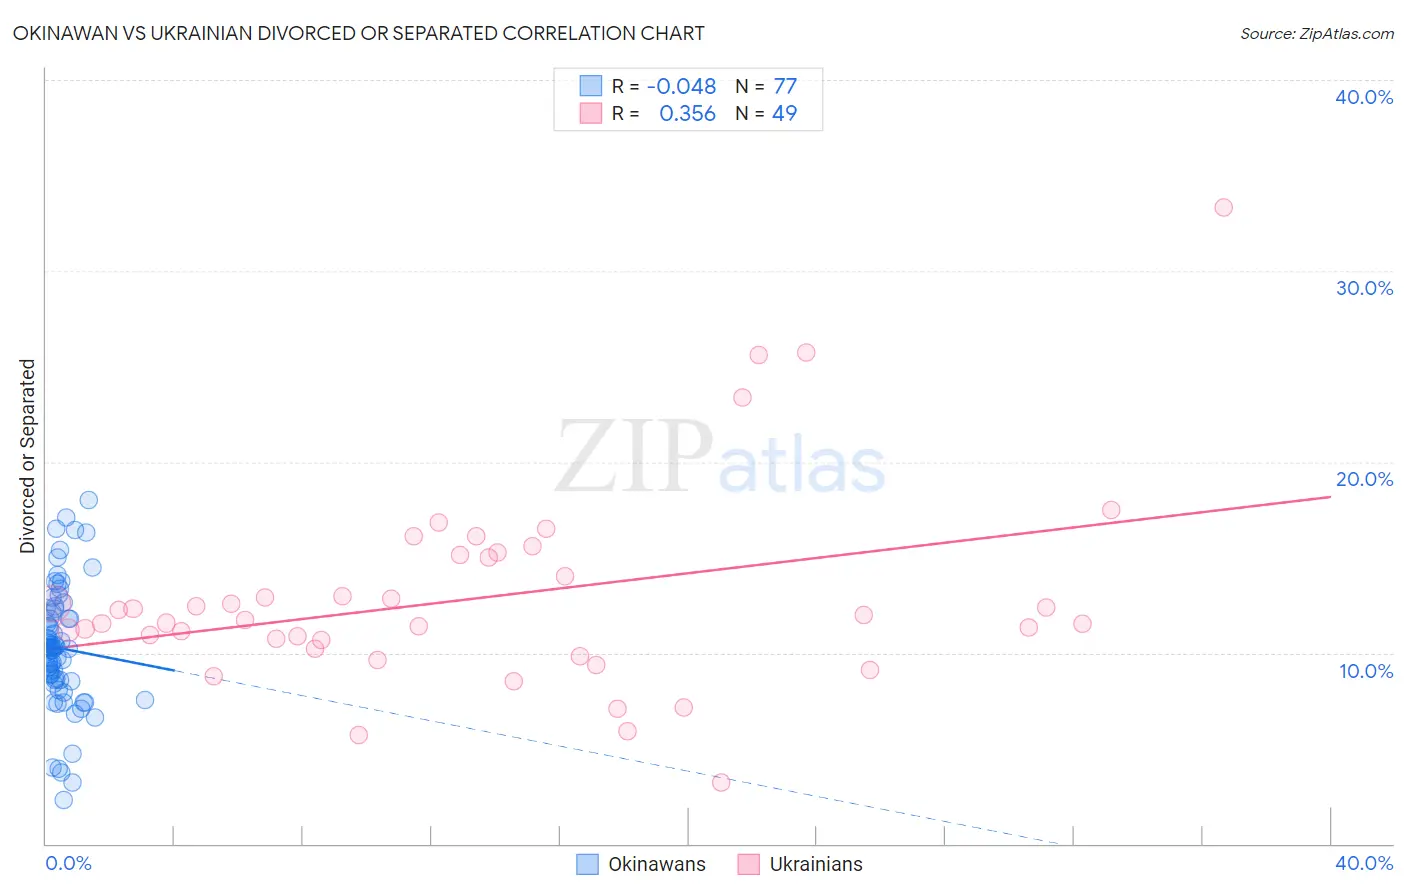
Okinawan vs Ukrainian Divorced or Separated Correlation Chart
The statistical analysis conducted on geographies consisting of 73,753,188 people shows no correlation between the proportion of Okinawans and percentage of population currently divorced or separated in the United States with a correlation coefficient (R) of -0.048 and weighted average of 10.5%. Similarly, the statistical analysis conducted on geographies consisting of 448,426,688 people shows a mild positive correlation between the proportion of Ukrainians and percentage of population currently divorced or separated in the United States with a correlation coefficient (R) of 0.356 and weighted average of 11.8%, a difference of 12.7%.
Divorced or Separated Correlation Summary
| Measurement | Okinawan | Ukrainian |
| Minimum | 2.3% | 3.2% |
| Maximum | 18.0% | 33.3% |
| Range | 15.7% | 30.1% |
| Mean | 10.2% | 12.9% |
| Median | 10.3% | 11.7% |
| Interquartile 25% (IQ1) | 8.5% | 10.5% |
| Interquartile 75% (IQ3) | 12.2% | 15.1% |
| Interquartile Range (IQR) | 3.7% | 4.6% |
| Standard Deviation (Sample) | 3.2% | 5.3% |
| Standard Deviation (Population) | 3.2% | 5.2% |
Similar Demographics by Divorced or Separated
Demographics Similar to Okinawans by Divorced or Separated
In terms of divorced or separated, the demographic groups most similar to Okinawans are Cypriot (10.5%, a difference of 0.16%), Immigrants from South Central Asia (10.4%, a difference of 0.34%), Assyrian/Chaldean/Syriac (10.6%, a difference of 0.90%), Immigrants from Armenia (10.6%, a difference of 0.97%), and Immigrants from Singapore (10.3%, a difference of 1.3%).
| Demographics | Rating | Rank | Divorced or Separated |
| Immigrants | India | 100.0 /100 | #5 | Exceptional 10.1% |
| Indians (Asian) | 100.0 /100 | #6 | Exceptional 10.2% |
| Thais | 100.0 /100 | #7 | Exceptional 10.2% |
| Immigrants | Eastern Asia | 100.0 /100 | #8 | Exceptional 10.2% |
| Yup'ik | 100.0 /100 | #9 | Exceptional 10.3% |
| Immigrants | Singapore | 100.0 /100 | #10 | Exceptional 10.3% |
| Immigrants | South Central Asia | 100.0 /100 | #11 | Exceptional 10.4% |
| Okinawans | 100.0 /100 | #12 | Exceptional 10.5% |
| Cypriots | 100.0 /100 | #13 | Exceptional 10.5% |
| Assyrians/Chaldeans/Syriacs | 100.0 /100 | #14 | Exceptional 10.6% |
| Immigrants | Armenia | 100.0 /100 | #15 | Exceptional 10.6% |
| Immigrants | Korea | 100.0 /100 | #16 | Exceptional 10.6% |
| Immigrants | Israel | 100.0 /100 | #17 | Exceptional 10.6% |
| Immigrants | Iran | 100.0 /100 | #18 | Exceptional 10.6% |
| Asians | 100.0 /100 | #19 | Exceptional 10.6% |
Demographics Similar to Ukrainians by Divorced or Separated
In terms of divorced or separated, the demographic groups most similar to Ukrainians are South American Indian (11.8%, a difference of 0.020%), Ugandan (11.8%, a difference of 0.11%), Immigrants (11.8%, a difference of 0.19%), Menominee (11.8%, a difference of 0.20%), and Romanian (11.8%, a difference of 0.32%).
| Demographics | Rating | Rank | Divorced or Separated |
| Ecuadorians | 95.3 /100 | #118 | Exceptional 11.7% |
| Syrians | 95.1 /100 | #119 | Exceptional 11.7% |
| Iraqis | 94.6 /100 | #120 | Exceptional 11.8% |
| Romanians | 94.5 /100 | #121 | Exceptional 11.8% |
| Menominee | 93.8 /100 | #122 | Exceptional 11.8% |
| Immigrants | Immigrants | 93.7 /100 | #123 | Exceptional 11.8% |
| Ugandans | 93.1 /100 | #124 | Exceptional 11.8% |
| Ukrainians | 92.3 /100 | #125 | Exceptional 11.8% |
| South American Indians | 92.1 /100 | #126 | Exceptional 11.8% |
| South Africans | 88.9 /100 | #127 | Excellent 11.8% |
| Immigrants | Ecuador | 88.9 /100 | #128 | Excellent 11.8% |
| Immigrants | St. Vincent and the Grenadines | 88.4 /100 | #129 | Excellent 11.8% |
| Immigrants | Austria | 88.2 /100 | #130 | Excellent 11.8% |
| Immigrants | Cambodia | 88.2 /100 | #131 | Excellent 11.8% |
| Immigrants | Afghanistan | 87.9 /100 | #132 | Excellent 11.8% |