Mexican vs French American Indian Single Mother Households
COMPARE
Mexican
French American Indian
Single Mother Households
Single Mother Households Comparison
Mexicans
French American Indians
8.0%
SINGLE MOTHER HOUSEHOLDS
0.0/ 100
METRIC RATING
300th/ 347
METRIC RANK
6.9%
SINGLE MOTHER HOUSEHOLDS
3.7/ 100
METRIC RATING
221st/ 347
METRIC RANK
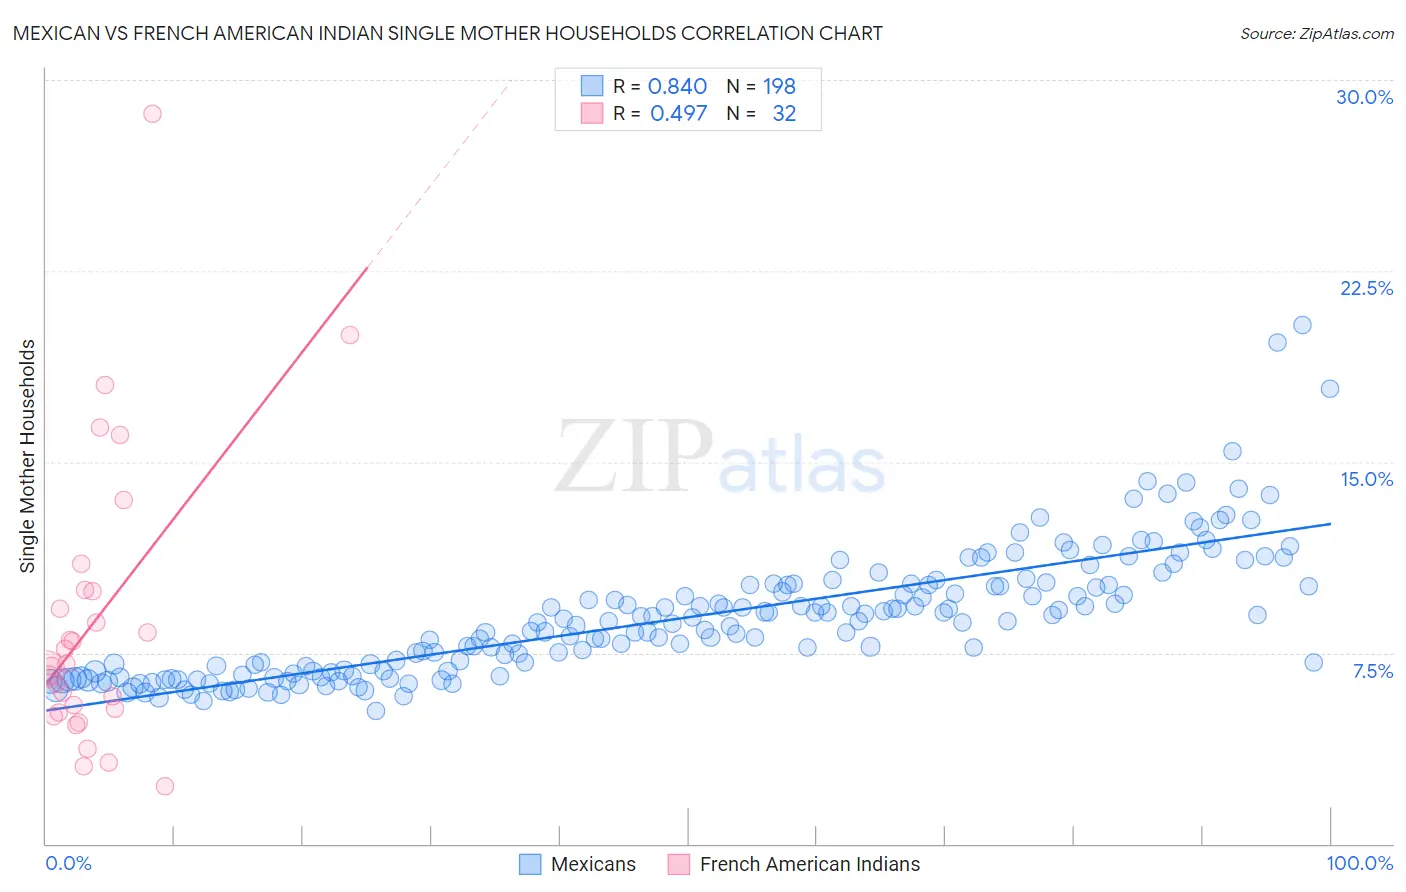
Mexican vs French American Indian Single Mother Households Correlation Chart
The statistical analysis conducted on geographies consisting of 560,737,784 people shows a very strong positive correlation between the proportion of Mexicans and percentage of single mother households in the United States with a correlation coefficient (R) of 0.840 and weighted average of 8.0%. Similarly, the statistical analysis conducted on geographies consisting of 131,861,238 people shows a moderate positive correlation between the proportion of French American Indians and percentage of single mother households in the United States with a correlation coefficient (R) of 0.497 and weighted average of 6.9%, a difference of 15.9%.
Single Mother Households Correlation Summary
| Measurement | Mexican | French American Indian |
| Minimum | 5.2% | 2.3% |
| Maximum | 20.4% | 28.7% |
| Range | 15.2% | 26.4% |
| Mean | 8.9% | 8.8% |
| Median | 8.7% | 7.0% |
| Interquartile 25% (IQ1) | 6.8% | 5.2% |
| Interquartile 75% (IQ3) | 10.1% | 9.9% |
| Interquartile Range (IQR) | 3.4% | 4.7% |
| Standard Deviation (Sample) | 2.5% | 5.7% |
| Standard Deviation (Population) | 2.5% | 5.6% |
Similar Demographics by Single Mother Households
Demographics Similar to Mexicans by Single Mother Households
In terms of single mother households, the demographic groups most similar to Mexicans are Chippewa (8.0%, a difference of 0.16%), Immigrants from Ghana (8.0%, a difference of 0.25%), Immigrants from Bahamas (8.0%, a difference of 0.27%), Houma (7.9%, a difference of 0.46%), and Immigrants from West Indies (7.9%, a difference of 0.54%).
| Demographics | Rating | Rank | Single Mother Households |
| Immigrants | Cameroon | 0.0 /100 | #293 | Tragic 7.9% |
| Apache | 0.0 /100 | #294 | Tragic 7.9% |
| Barbadians | 0.0 /100 | #295 | Tragic 7.9% |
| Immigrants | Latin America | 0.0 /100 | #296 | Tragic 7.9% |
| Hispanics or Latinos | 0.0 /100 | #297 | Tragic 7.9% |
| Immigrants | West Indies | 0.0 /100 | #298 | Tragic 7.9% |
| Houma | 0.0 /100 | #299 | Tragic 7.9% |
| Mexicans | 0.0 /100 | #300 | Tragic 8.0% |
| Chippewa | 0.0 /100 | #301 | Tragic 8.0% |
| Immigrants | Ghana | 0.0 /100 | #302 | Tragic 8.0% |
| Immigrants | Bahamas | 0.0 /100 | #303 | Tragic 8.0% |
| Natives/Alaskans | 0.0 /100 | #304 | Tragic 8.0% |
| Colville | 0.0 /100 | #305 | Tragic 8.0% |
| Immigrants | Barbados | 0.0 /100 | #306 | Tragic 8.0% |
| Immigrants | St. Vincent and the Grenadines | 0.0 /100 | #307 | Tragic 8.0% |
Demographics Similar to French American Indians by Single Mother Households
In terms of single mother households, the demographic groups most similar to French American Indians are Immigrants from Bangladesh (6.9%, a difference of 0.020%), Immigrants from Micronesia (6.9%, a difference of 0.070%), Immigrants from Thailand (6.9%, a difference of 0.19%), Immigrants from Sudan (6.9%, a difference of 0.19%), and Immigrants (6.8%, a difference of 0.38%).
| Demographics | Rating | Rank | Single Mother Households |
| Immigrants | Uruguay | 7.9 /100 | #214 | Tragic 6.7% |
| Shoshone | 5.7 /100 | #215 | Tragic 6.8% |
| Cherokee | 5.1 /100 | #216 | Tragic 6.8% |
| Aleuts | 4.8 /100 | #217 | Tragic 6.8% |
| Immigrants | Eastern Africa | 4.4 /100 | #218 | Tragic 6.8% |
| Immigrants | Immigrants | 4.3 /100 | #219 | Tragic 6.8% |
| Immigrants | Thailand | 4.0 /100 | #220 | Tragic 6.9% |
| French American Indians | 3.7 /100 | #221 | Tragic 6.9% |
| Immigrants | Bangladesh | 3.7 /100 | #222 | Tragic 6.9% |
| Immigrants | Micronesia | 3.6 /100 | #223 | Tragic 6.9% |
| Immigrants | Sudan | 3.5 /100 | #224 | Tragic 6.9% |
| Sudanese | 3.1 /100 | #225 | Tragic 6.9% |
| Paiute | 2.4 /100 | #226 | Tragic 7.0% |
| Kenyans | 2.3 /100 | #227 | Tragic 7.0% |
| Iroquois | 2.2 /100 | #228 | Tragic 7.0% |