Italian vs Austrian Average Family Size
COMPARE
Italian
Austrian
Average Family Size
Average Family Size Comparison
Italians
Austrians
3.12
AVERAGE FAMILY SIZE
0.1/ 100
METRIC RATING
317th/ 347
METRIC RANK
3.14
AVERAGE FAMILY SIZE
0.2/ 100
METRIC RATING
295th/ 347
METRIC RANK
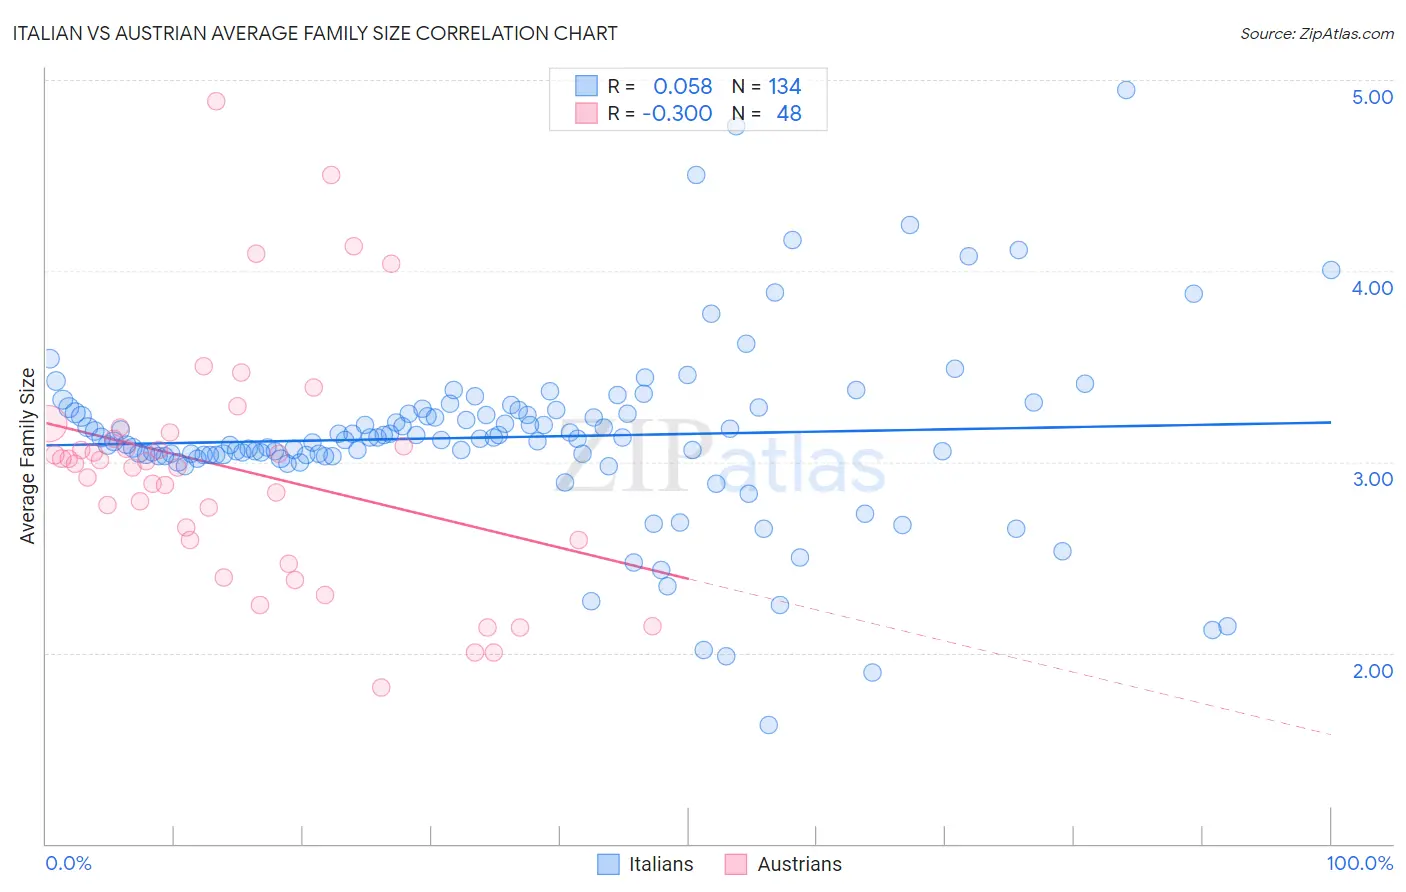
Italian vs Austrian Average Family Size Correlation Chart
The statistical analysis conducted on geographies consisting of 574,452,986 people shows a slight positive correlation between the proportion of Italians and average family size in the United States with a correlation coefficient (R) of 0.058 and weighted average of 3.12. Similarly, the statistical analysis conducted on geographies consisting of 451,810,696 people shows a mild negative correlation between the proportion of Austrians and average family size in the United States with a correlation coefficient (R) of -0.300 and weighted average of 3.14, a difference of 0.62%.
Average Family Size Correlation Summary
| Measurement | Italian | Austrian |
| Minimum | 1.62 | 1.82 |
| Maximum | 4.95 | 4.89 |
| Range | 3.33 | 3.07 |
| Mean | 3.13 | 2.96 |
| Median | 3.12 | 3.00 |
| Interquartile 25% (IQ1) | 3.04 | 2.59 |
| Interquartile 75% (IQ3) | 3.26 | 3.14 |
| Interquartile Range (IQR) | 0.22 | 0.55 |
| Standard Deviation (Sample) | 0.47 | 0.63 |
| Standard Deviation (Population) | 0.47 | 0.62 |
Similar Demographics by Average Family Size
Demographics Similar to Italians by Average Family Size
In terms of average family size, the demographic groups most similar to Italians are Eastern European (3.12, a difference of 0.010%), Welsh (3.12, a difference of 0.010%), Serbian (3.12, a difference of 0.060%), Immigrants from North America (3.12, a difference of 0.080%), and Immigrants from Austria (3.12, a difference of 0.11%).
| Demographics | Rating | Rank | Average Family Size |
| Czechoslovakians | 0.1 /100 | #310 | Tragic 3.13 |
| Immigrants | Northern Europe | 0.1 /100 | #311 | Tragic 3.13 |
| Immigrants | Australia | 0.1 /100 | #312 | Tragic 3.13 |
| Bulgarians | 0.1 /100 | #313 | Tragic 3.13 |
| Russians | 0.1 /100 | #314 | Tragic 3.12 |
| Immigrants | Scotland | 0.1 /100 | #315 | Tragic 3.12 |
| Serbians | 0.1 /100 | #316 | Tragic 3.12 |
| Italians | 0.1 /100 | #317 | Tragic 3.12 |
| Eastern Europeans | 0.1 /100 | #318 | Tragic 3.12 |
| Welsh | 0.1 /100 | #319 | Tragic 3.12 |
| Immigrants | North America | 0.0 /100 | #320 | Tragic 3.12 |
| Immigrants | Austria | 0.0 /100 | #321 | Tragic 3.12 |
| Immigrants | Canada | 0.0 /100 | #322 | Tragic 3.12 |
| Soviet Union | 0.0 /100 | #323 | Tragic 3.11 |
| Celtics | 0.0 /100 | #324 | Tragic 3.11 |
Demographics Similar to Austrians by Average Family Size
In terms of average family size, the demographic groups most similar to Austrians are Ukrainian (3.14, a difference of 0.0%), Immigrants from Western Europe (3.14, a difference of 0.0%), Immigrants from Croatia (3.14, a difference of 0.010%), Colville (3.14, a difference of 0.010%), and European (3.14, a difference of 0.030%).
| Demographics | Rating | Rank | Average Family Size |
| Immigrants | Czechoslovakia | 0.3 /100 | #288 | Tragic 3.14 |
| Immigrants | Norway | 0.3 /100 | #289 | Tragic 3.14 |
| Cypriots | 0.3 /100 | #290 | Tragic 3.14 |
| Alsatians | 0.2 /100 | #291 | Tragic 3.14 |
| Europeans | 0.2 /100 | #292 | Tragic 3.14 |
| Scandinavians | 0.2 /100 | #293 | Tragic 3.14 |
| Immigrants | Croatia | 0.2 /100 | #294 | Tragic 3.14 |
| Austrians | 0.2 /100 | #295 | Tragic 3.14 |
| Ukrainians | 0.2 /100 | #296 | Tragic 3.14 |
| Immigrants | Western Europe | 0.2 /100 | #297 | Tragic 3.14 |
| Colville | 0.2 /100 | #298 | Tragic 3.14 |
| Canadians | 0.2 /100 | #299 | Tragic 3.14 |
| Immigrants | Sweden | 0.2 /100 | #300 | Tragic 3.14 |
| Macedonians | 0.2 /100 | #301 | Tragic 3.13 |
| Immigrants | Latvia | 0.2 /100 | #302 | Tragic 3.13 |