Indonesian vs Immigrants from Middle Africa Divorced or Separated
COMPARE
Indonesian
Immigrants from Middle Africa
Divorced or Separated
Divorced or Separated Comparison
Indonesians
Immigrants from Middle Africa
12.6%
DIVORCED OR SEPARATED
0.6/ 100
METRIC RATING
258th/ 347
METRIC RANK
12.7%
DIVORCED OR SEPARATED
0.3/ 100
METRIC RATING
272nd/ 347
METRIC RANK
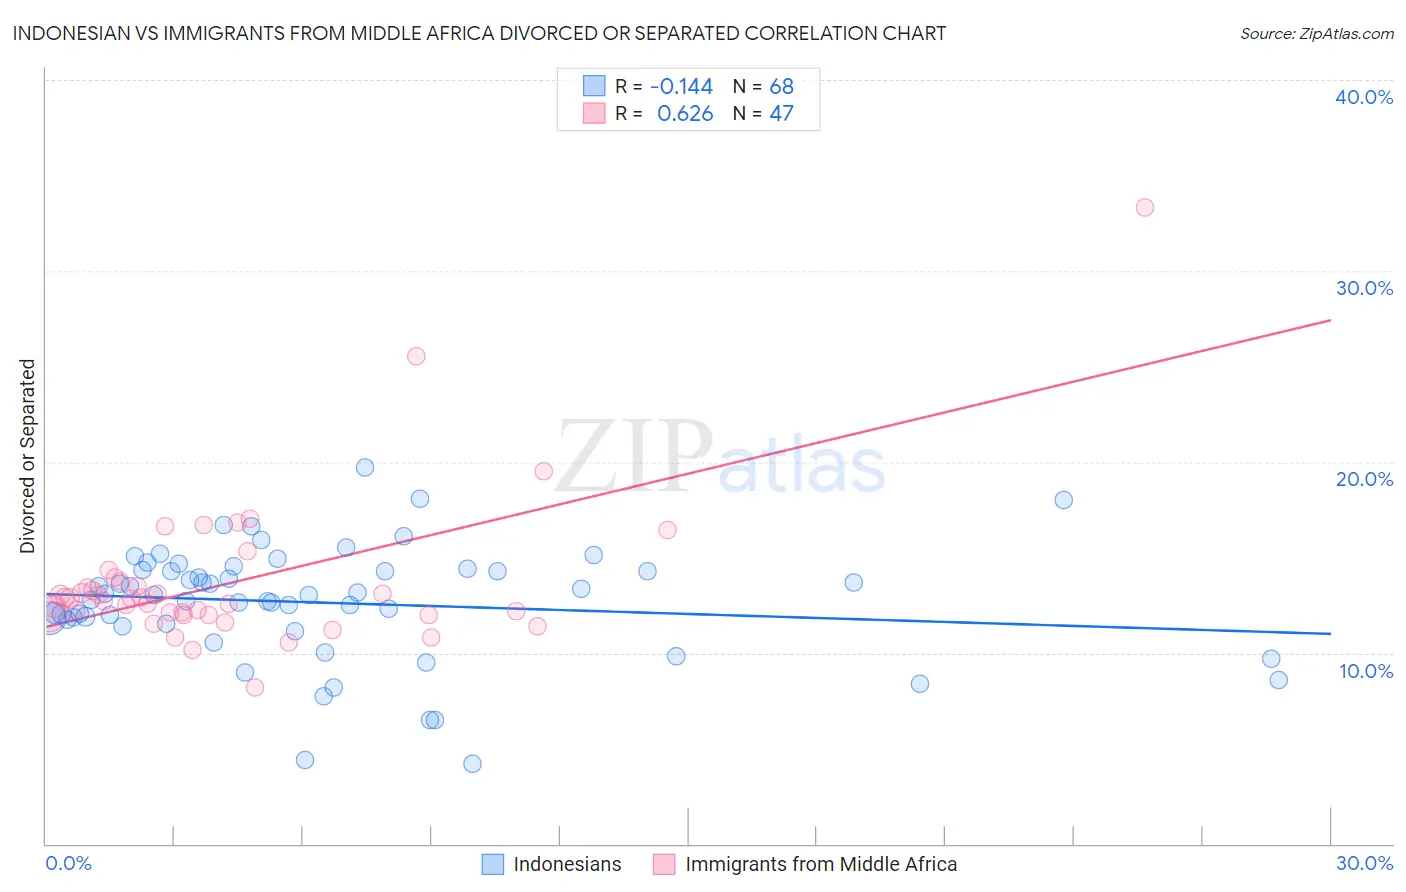
Indonesian vs Immigrants from Middle Africa Divorced or Separated Correlation Chart
The statistical analysis conducted on geographies consisting of 162,660,100 people shows a poor negative correlation between the proportion of Indonesians and percentage of population currently divorced or separated in the United States with a correlation coefficient (R) of -0.144 and weighted average of 12.6%. Similarly, the statistical analysis conducted on geographies consisting of 202,678,495 people shows a significant positive correlation between the proportion of Immigrants from Middle Africa and percentage of population currently divorced or separated in the United States with a correlation coefficient (R) of 0.626 and weighted average of 12.7%, a difference of 0.51%.
Divorced or Separated Correlation Summary
| Measurement | Indonesian | Immigrants from Middle Africa |
| Minimum | 4.2% | 8.2% |
| Maximum | 19.7% | 33.3% |
| Range | 15.5% | 25.1% |
| Mean | 12.6% | 13.7% |
| Median | 13.0% | 12.8% |
| Interquartile 25% (IQ1) | 11.6% | 12.0% |
| Interquartile 75% (IQ3) | 14.3% | 13.7% |
| Interquartile Range (IQR) | 2.7% | 1.7% |
| Standard Deviation (Sample) | 3.0% | 4.0% |
| Standard Deviation (Population) | 2.9% | 3.9% |
Demographics Similar to Indonesians and Immigrants from Middle Africa by Divorced or Separated
In terms of divorced or separated, the demographic groups most similar to Indonesians are Immigrants from Somalia (12.6%, a difference of 0.0%), Immigrants from Colombia (12.6%, a difference of 0.010%), Yuman (12.6%, a difference of 0.020%), Immigrants from Uruguay (12.6%, a difference of 0.020%), and Immigrants from Dominica (12.6%, a difference of 0.050%). Similarly, the demographic groups most similar to Immigrants from Middle Africa are Panamanian (12.7%, a difference of 0.050%), Ute (12.6%, a difference of 0.11%), Immigrants from Micronesia (12.7%, a difference of 0.12%), Bermudan (12.7%, a difference of 0.13%), and Central American Indian (12.7%, a difference of 0.16%).
| Demographics | Rating | Rank | Divorced or Separated |
| Welsh | 0.7 /100 | #255 | Tragic 12.6% |
| Immigrants | Colombia | 0.6 /100 | #256 | Tragic 12.6% |
| Immigrants | Somalia | 0.6 /100 | #257 | Tragic 12.6% |
| Indonesians | 0.6 /100 | #258 | Tragic 12.6% |
| Yuman | 0.6 /100 | #259 | Tragic 12.6% |
| Immigrants | Uruguay | 0.6 /100 | #260 | Tragic 12.6% |
| Immigrants | Dominica | 0.5 /100 | #261 | Tragic 12.6% |
| Basques | 0.5 /100 | #262 | Tragic 12.6% |
| Immigrants | Panama | 0.5 /100 | #263 | Tragic 12.6% |
| English | 0.5 /100 | #264 | Tragic 12.6% |
| Immigrants | Senegal | 0.5 /100 | #265 | Tragic 12.6% |
| Whites/Caucasians | 0.5 /100 | #266 | Tragic 12.6% |
| Scottish | 0.4 /100 | #267 | Tragic 12.6% |
| Fijians | 0.4 /100 | #268 | Tragic 12.6% |
| Immigrants | Liberia | 0.4 /100 | #269 | Tragic 12.6% |
| Ute | 0.4 /100 | #270 | Tragic 12.6% |
| Panamanians | 0.3 /100 | #271 | Tragic 12.7% |
| Immigrants | Middle Africa | 0.3 /100 | #272 | Tragic 12.7% |
| Immigrants | Micronesia | 0.3 /100 | #273 | Tragic 12.7% |
| Bermudans | 0.3 /100 | #274 | Tragic 12.7% |
| Central American Indians | 0.3 /100 | #275 | Tragic 12.7% |