Indian (Asian) vs Iraqi Births to Unmarried Women
COMPARE
Indian (Asian)
Iraqi
Births to Unmarried Women
Births to Unmarried Women Comparison
Indians (Asian)
Iraqis
25.3%
BIRTHS TO UNMARRIED WOMEN
100.0/ 100
METRIC RATING
12th/ 347
METRIC RANK
27.6%
BIRTHS TO UNMARRIED WOMEN
99.6/ 100
METRIC RATING
41st/ 347
METRIC RANK
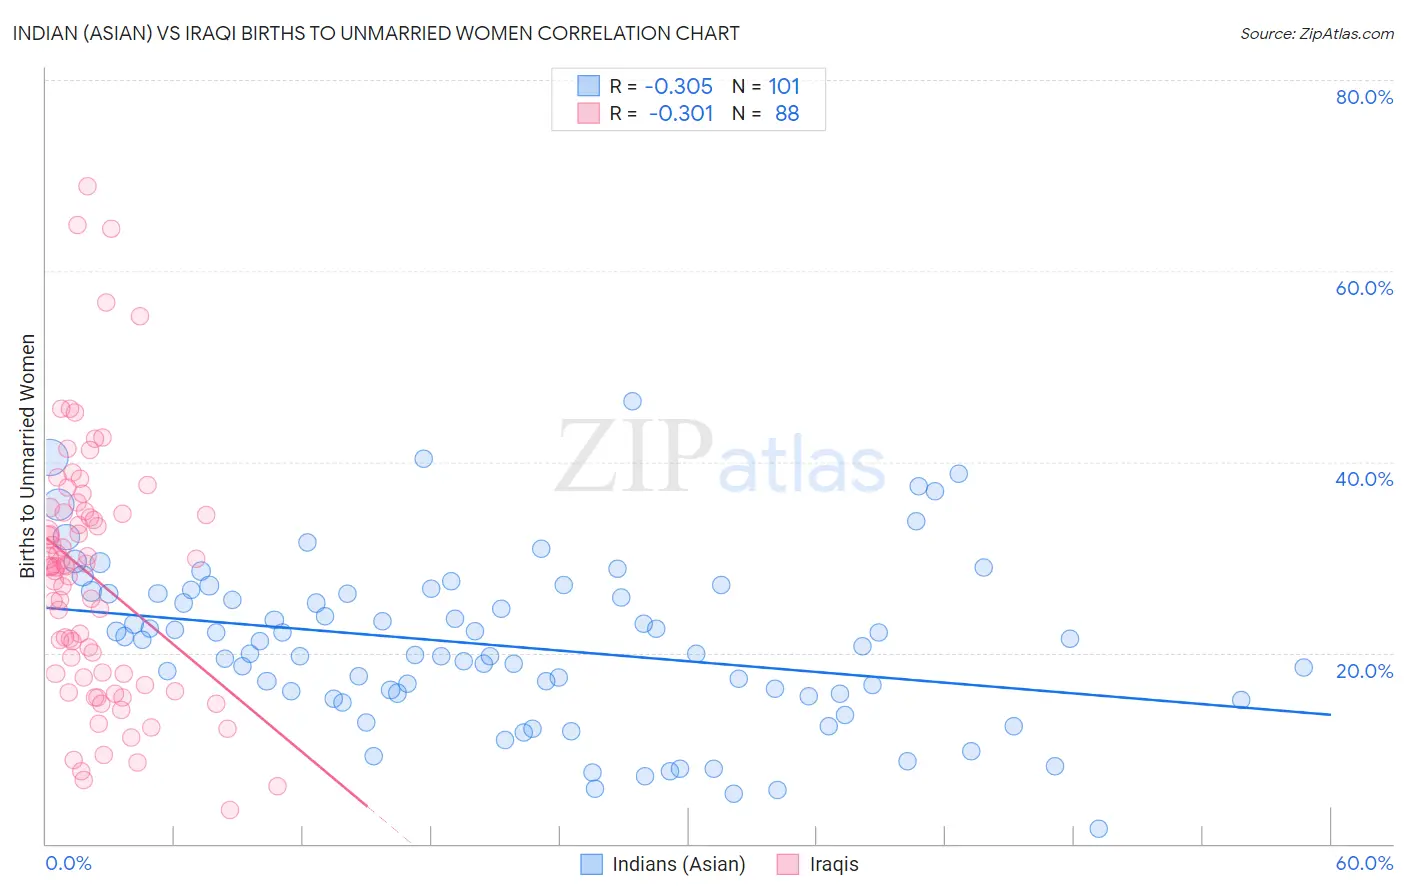
Indian (Asian) vs Iraqi Births to Unmarried Women Correlation Chart
The statistical analysis conducted on geographies consisting of 453,301,361 people shows a mild negative correlation between the proportion of Indians (Asian) and percentage of births to unmarried women in the United States with a correlation coefficient (R) of -0.305 and weighted average of 25.3%. Similarly, the statistical analysis conducted on geographies consisting of 164,715,067 people shows a mild negative correlation between the proportion of Iraqis and percentage of births to unmarried women in the United States with a correlation coefficient (R) of -0.301 and weighted average of 27.6%, a difference of 9.1%.
Births to Unmarried Women Correlation Summary
| Measurement | Indian (Asian) | Iraqi |
| Minimum | 1.6% | 3.6% |
| Maximum | 46.3% | 68.9% |
| Range | 44.7% | 65.3% |
| Mean | 20.7% | 27.9% |
| Median | 20.7% | 29.0% |
| Interquartile 25% (IQ1) | 15.5% | 17.6% |
| Interquartile 75% (IQ3) | 26.2% | 34.6% |
| Interquartile Range (IQR) | 10.7% | 17.0% |
| Standard Deviation (Sample) | 8.6% | 13.3% |
| Standard Deviation (Population) | 8.6% | 13.2% |
Similar Demographics by Births to Unmarried Women
Demographics Similar to Indians (Asian) by Births to Unmarried Women
In terms of births to unmarried women, the demographic groups most similar to Indians (Asian) are Iranian (25.3%, a difference of 0.14%), Immigrants from Lebanon (25.3%, a difference of 0.26%), Immigrants from Israel (25.1%, a difference of 0.47%), Immigrants from Eastern Asia (25.0%, a difference of 0.90%), and Immigrants from Singapore (25.6%, a difference of 1.4%).
| Demographics | Rating | Rank | Births to Unmarried Women |
| Immigrants | Hong Kong | 100.0 /100 | #5 | Exceptional 23.6% |
| Immigrants | Iran | 100.0 /100 | #6 | Exceptional 24.0% |
| Thais | 100.0 /100 | #7 | Exceptional 24.0% |
| Immigrants | China | 100.0 /100 | #8 | Exceptional 24.7% |
| Immigrants | South Central Asia | 100.0 /100 | #9 | Exceptional 24.7% |
| Immigrants | Eastern Asia | 100.0 /100 | #10 | Exceptional 25.0% |
| Immigrants | Israel | 100.0 /100 | #11 | Exceptional 25.1% |
| Indians (Asian) | 100.0 /100 | #12 | Exceptional 25.3% |
| Iranians | 100.0 /100 | #13 | Exceptional 25.3% |
| Immigrants | Lebanon | 100.0 /100 | #14 | Exceptional 25.3% |
| Immigrants | Singapore | 100.0 /100 | #15 | Exceptional 25.6% |
| Immigrants | Belarus | 100.0 /100 | #16 | Exceptional 25.6% |
| Immigrants | Uzbekistan | 100.0 /100 | #17 | Exceptional 25.8% |
| Immigrants | Armenia | 99.9 /100 | #18 | Exceptional 26.1% |
| Armenians | 99.9 /100 | #19 | Exceptional 26.2% |
Demographics Similar to Iraqis by Births to Unmarried Women
In terms of births to unmarried women, the demographic groups most similar to Iraqis are Immigrants from Eastern Europe (27.6%, a difference of 0.020%), Immigrants from Bulgaria (27.6%, a difference of 0.24%), Turkish (27.4%, a difference of 0.41%), Immigrants from Indonesia (27.7%, a difference of 0.51%), and Latvian (27.7%, a difference of 0.60%).
| Demographics | Rating | Rank | Births to Unmarried Women |
| Immigrants | Pakistan | 99.8 /100 | #34 | Exceptional 27.2% |
| Immigrants | Ireland | 99.7 /100 | #35 | Exceptional 27.2% |
| Immigrants | Western Asia | 99.7 /100 | #36 | Exceptional 27.2% |
| Immigrants | Ukraine | 99.7 /100 | #37 | Exceptional 27.2% |
| Immigrants | Moldova | 99.7 /100 | #38 | Exceptional 27.3% |
| Immigrants | Malaysia | 99.7 /100 | #39 | Exceptional 27.4% |
| Turks | 99.6 /100 | #40 | Exceptional 27.4% |
| Iraqis | 99.6 /100 | #41 | Exceptional 27.6% |
| Immigrants | Eastern Europe | 99.6 /100 | #42 | Exceptional 27.6% |
| Immigrants | Bulgaria | 99.6 /100 | #43 | Exceptional 27.6% |
| Immigrants | Indonesia | 99.5 /100 | #44 | Exceptional 27.7% |
| Latvians | 99.5 /100 | #45 | Exceptional 27.7% |
| Immigrants | Lithuania | 99.5 /100 | #46 | Exceptional 27.7% |
| Hmong | 99.5 /100 | #47 | Exceptional 27.7% |
| Eastern Europeans | 99.5 /100 | #48 | Exceptional 27.7% |