Immigrants from Yemen vs Canadian Currently Married
COMPARE
Immigrants from Yemen
Canadian
Currently Married
Currently Married Comparison
Immigrants from Yemen
Canadians
42.1%
CURRENTLY MARRIED
0.0/ 100
METRIC RATING
301st/ 347
METRIC RANK
48.3%
CURRENTLY MARRIED
98.1/ 100
METRIC RATING
69th/ 347
METRIC RANK
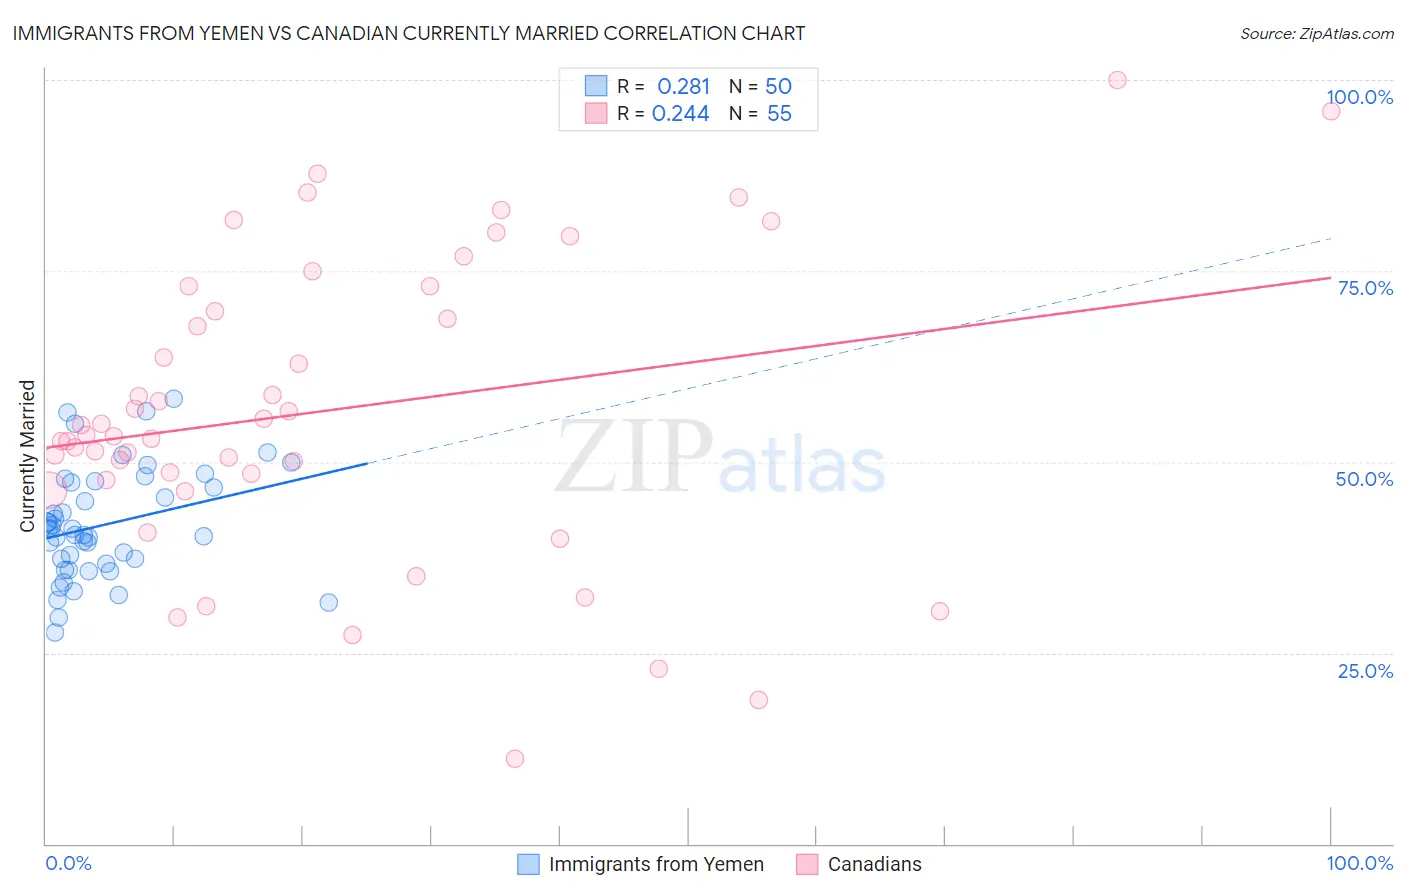
Immigrants from Yemen vs Canadian Currently Married Correlation Chart
The statistical analysis conducted on geographies consisting of 82,431,124 people shows a weak positive correlation between the proportion of Immigrants from Yemen and percentage of population currently married in the United States with a correlation coefficient (R) of 0.281 and weighted average of 42.1%. Similarly, the statistical analysis conducted on geographies consisting of 437,507,905 people shows a weak positive correlation between the proportion of Canadians and percentage of population currently married in the United States with a correlation coefficient (R) of 0.244 and weighted average of 48.3%, a difference of 14.9%.
Currently Married Correlation Summary
| Measurement | Immigrants from Yemen | Canadian |
| Minimum | 27.6% | 11.1% |
| Maximum | 58.2% | 100.0% |
| Range | 30.6% | 88.9% |
| Mean | 41.7% | 56.8% |
| Median | 40.8% | 53.5% |
| Interquartile 25% (IQ1) | 36.6% | 47.6% |
| Interquartile 75% (IQ3) | 47.3% | 73.0% |
| Interquartile Range (IQR) | 10.7% | 25.3% |
| Standard Deviation (Sample) | 7.2% | 19.6% |
| Standard Deviation (Population) | 7.1% | 19.4% |
Similar Demographics by Currently Married
Demographics Similar to Immigrants from Yemen by Currently Married
In terms of currently married, the demographic groups most similar to Immigrants from Yemen are Belizean (42.2%, a difference of 0.24%), Immigrants from Zaire (42.0%, a difference of 0.25%), Sioux (41.9%, a difference of 0.26%), Liberian (42.2%, a difference of 0.34%), and Immigrants from Honduras (42.2%, a difference of 0.37%).
| Demographics | Rating | Rank | Currently Married |
| Hondurans | 0.0 /100 | #294 | Tragic 42.5% |
| Immigrants | Western Africa | 0.0 /100 | #295 | Tragic 42.4% |
| Menominee | 0.0 /100 | #296 | Tragic 42.3% |
| Cheyenne | 0.0 /100 | #297 | Tragic 42.2% |
| Immigrants | Honduras | 0.0 /100 | #298 | Tragic 42.2% |
| Liberians | 0.0 /100 | #299 | Tragic 42.2% |
| Belizeans | 0.0 /100 | #300 | Tragic 42.2% |
| Immigrants | Yemen | 0.0 /100 | #301 | Tragic 42.1% |
| Immigrants | Zaire | 0.0 /100 | #302 | Tragic 42.0% |
| Sioux | 0.0 /100 | #303 | Tragic 41.9% |
| Immigrants | Bahamas | 0.0 /100 | #304 | Tragic 41.9% |
| Immigrants | Trinidad and Tobago | 0.0 /100 | #305 | Tragic 41.9% |
| Immigrants | Guyana | 0.0 /100 | #306 | Tragic 41.9% |
| Africans | 0.0 /100 | #307 | Tragic 41.8% |
| Immigrants | Belize | 0.0 /100 | #308 | Tragic 41.8% |
Demographics Similar to Canadians by Currently Married
In terms of currently married, the demographic groups most similar to Canadians are Slovak (48.3%, a difference of 0.020%), Immigrants from England (48.3%, a difference of 0.020%), Tongan (48.3%, a difference of 0.040%), Immigrants from Czechoslovakia (48.4%, a difference of 0.070%), and Ukrainian (48.4%, a difference of 0.070%).
| Demographics | Rating | Rank | Currently Married |
| Asians | 98.5 /100 | #62 | Exceptional 48.4% |
| Slavs | 98.3 /100 | #63 | Exceptional 48.4% |
| Immigrants | Czechoslovakia | 98.3 /100 | #64 | Exceptional 48.4% |
| Ukrainians | 98.3 /100 | #65 | Exceptional 48.4% |
| Tongans | 98.2 /100 | #66 | Exceptional 48.3% |
| Slovaks | 98.2 /100 | #67 | Exceptional 48.3% |
| Immigrants | England | 98.2 /100 | #68 | Exceptional 48.3% |
| Canadians | 98.1 /100 | #69 | Exceptional 48.3% |
| Immigrants | Asia | 97.9 /100 | #70 | Exceptional 48.3% |
| Macedonians | 97.9 /100 | #71 | Exceptional 48.3% |
| Immigrants | Lebanon | 97.6 /100 | #72 | Exceptional 48.2% |
| Immigrants | Eastern Asia | 97.5 /100 | #73 | Exceptional 48.2% |
| Estonians | 97.4 /100 | #74 | Exceptional 48.2% |
| Immigrants | Belarus | 97.2 /100 | #75 | Exceptional 48.1% |
| Basques | 97.2 /100 | #76 | Exceptional 48.1% |