Immigrants from West Indies vs Immigrants from Laos Births to Unmarried Women
COMPARE
Immigrants from West Indies
Immigrants from Laos
Births to Unmarried Women
Births to Unmarried Women Comparison
Immigrants from West Indies
Immigrants from Laos
38.6%
BIRTHS TO UNMARRIED WOMEN
0.0/ 100
METRIC RATING
300th/ 347
METRIC RANK
34.0%
BIRTHS TO UNMARRIED WOMEN
4.3/ 100
METRIC RATING
224th/ 347
METRIC RANK
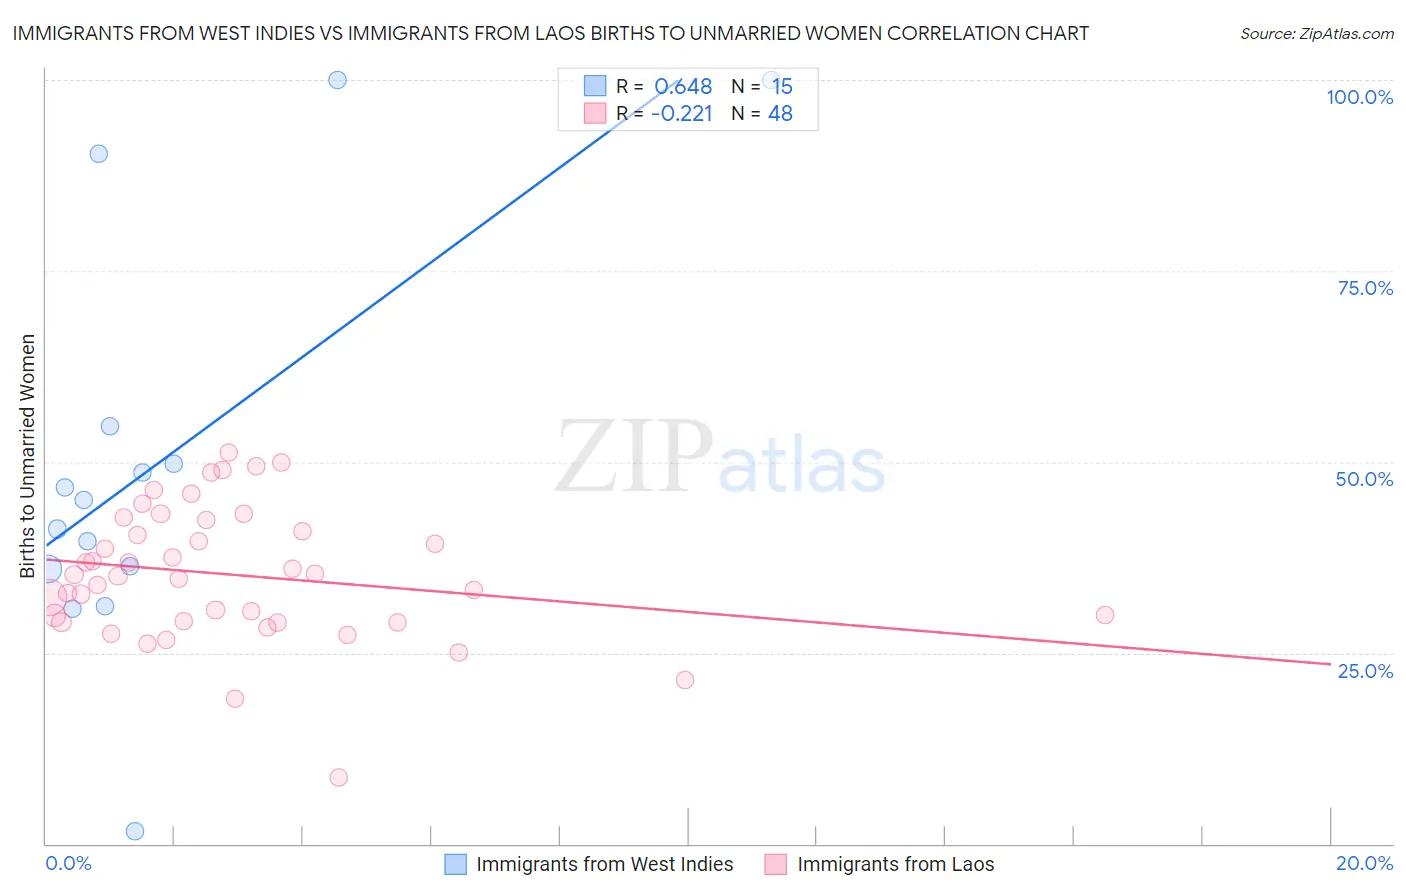
Immigrants from West Indies vs Immigrants from Laos Births to Unmarried Women Correlation Chart
The statistical analysis conducted on geographies consisting of 71,872,007 people shows a significant positive correlation between the proportion of Immigrants from West Indies and percentage of births to unmarried women in the United States with a correlation coefficient (R) of 0.648 and weighted average of 38.6%. Similarly, the statistical analysis conducted on geographies consisting of 196,196,107 people shows a weak negative correlation between the proportion of Immigrants from Laos and percentage of births to unmarried women in the United States with a correlation coefficient (R) of -0.221 and weighted average of 34.0%, a difference of 13.5%.
Births to Unmarried Women Correlation Summary
| Measurement | Immigrants from West Indies | Immigrants from Laos |
| Minimum | 1.6% | 8.7% |
| Maximum | 100.0% | 51.2% |
| Range | 98.4% | 42.5% |
| Mean | 50.1% | 35.2% |
| Median | 44.9% | 35.1% |
| Interquartile 25% (IQ1) | 36.0% | 29.1% |
| Interquartile 75% (IQ3) | 54.6% | 41.7% |
| Interquartile Range (IQR) | 18.6% | 12.6% |
| Standard Deviation (Sample) | 27.2% | 8.7% |
| Standard Deviation (Population) | 26.2% | 8.6% |
Similar Demographics by Births to Unmarried Women
Demographics Similar to Immigrants from West Indies by Births to Unmarried Women
In terms of births to unmarried women, the demographic groups most similar to Immigrants from West Indies are Haitian (38.6%, a difference of 0.010%), Spanish American (38.6%, a difference of 0.060%), Honduran (38.7%, a difference of 0.25%), Jamaican (38.5%, a difference of 0.26%), and Dutch West Indian (38.4%, a difference of 0.46%).
| Demographics | Rating | Rank | Births to Unmarried Women |
| Immigrants | Nicaragua | 0.0 /100 | #293 | Tragic 38.0% |
| British West Indians | 0.0 /100 | #294 | Tragic 38.0% |
| Iroquois | 0.0 /100 | #295 | Tragic 38.2% |
| Alaska Natives | 0.0 /100 | #296 | Tragic 38.3% |
| Dutch West Indians | 0.0 /100 | #297 | Tragic 38.4% |
| Jamaicans | 0.0 /100 | #298 | Tragic 38.5% |
| Spanish Americans | 0.0 /100 | #299 | Tragic 38.6% |
| Immigrants | West Indies | 0.0 /100 | #300 | Tragic 38.6% |
| Haitians | 0.0 /100 | #301 | Tragic 38.6% |
| Hondurans | 0.0 /100 | #302 | Tragic 38.7% |
| Immigrants | Jamaica | 0.0 /100 | #303 | Tragic 38.8% |
| Yaqui | 0.0 /100 | #304 | Tragic 38.8% |
| Immigrants | Haiti | 0.0 /100 | #305 | Tragic 38.9% |
| Central American Indians | 0.0 /100 | #306 | Tragic 39.0% |
| Immigrants | Honduras | 0.0 /100 | #307 | Tragic 39.3% |
Demographics Similar to Immigrants from Laos by Births to Unmarried Women
In terms of births to unmarried women, the demographic groups most similar to Immigrants from Laos are Pennsylvania German (34.0%, a difference of 0.0%), Spanish (34.1%, a difference of 0.16%), Immigrants from Uruguay (33.9%, a difference of 0.29%), Malaysian (33.9%, a difference of 0.36%), and Portuguese (33.8%, a difference of 0.53%).
| Demographics | Rating | Rank | Births to Unmarried Women |
| Spaniards | 7.0 /100 | #217 | Tragic 33.6% |
| Immigrants | Ecuador | 5.9 /100 | #218 | Tragic 33.7% |
| Alsatians | 5.4 /100 | #219 | Tragic 33.8% |
| Portuguese | 5.4 /100 | #220 | Tragic 33.8% |
| Malaysians | 5.0 /100 | #221 | Tragic 33.9% |
| Immigrants | Uruguay | 4.8 /100 | #222 | Tragic 33.9% |
| Pennsylvania Germans | 4.3 /100 | #223 | Tragic 34.0% |
| Immigrants | Laos | 4.3 /100 | #224 | Tragic 34.0% |
| Spanish | 4.0 /100 | #225 | Tragic 34.1% |
| Delaware | 3.3 /100 | #226 | Tragic 34.2% |
| Immigrants | Panama | 3.3 /100 | #227 | Tragic 34.2% |
| Panamanians | 3.3 /100 | #228 | Tragic 34.2% |
| Immigrants | Sierra Leone | 3.1 /100 | #229 | Tragic 34.2% |
| Ghanaians | 3.1 /100 | #230 | Tragic 34.3% |
| Native Hawaiians | 2.9 /100 | #231 | Tragic 34.3% |